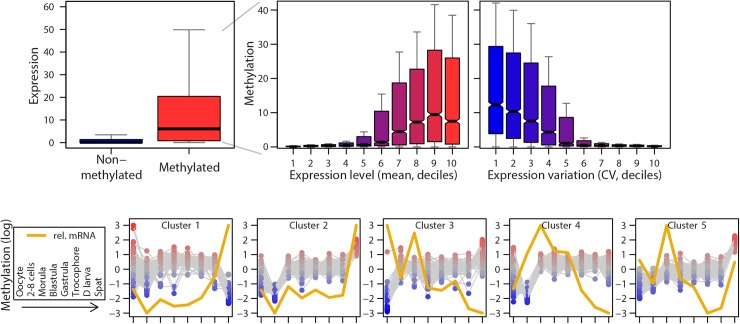
Fig 3. Methylation dynamics correspond to expression dynamics during oyster development.
a:CDS methylation level is associated to expression level during development. Expression level of non-methylated and methylated genes (CDS methylation is shown, left). Relation between CDS methylation and mRNA levels (mean across development stages, deciles) of the methylated genes (middle). Relation between CDS methylation and expression variability of the methylated genes (coefficient of variation (CV) across development stages, deciles) (right). b: Developmental methylation (grey) and mRNA kinetics (yellow) of the 5 gene clusters obtained by K-means clustering of differentially methylated genes (1-way ANOVA of normalized CDS methylation against developmental stages, p<0.0001).

