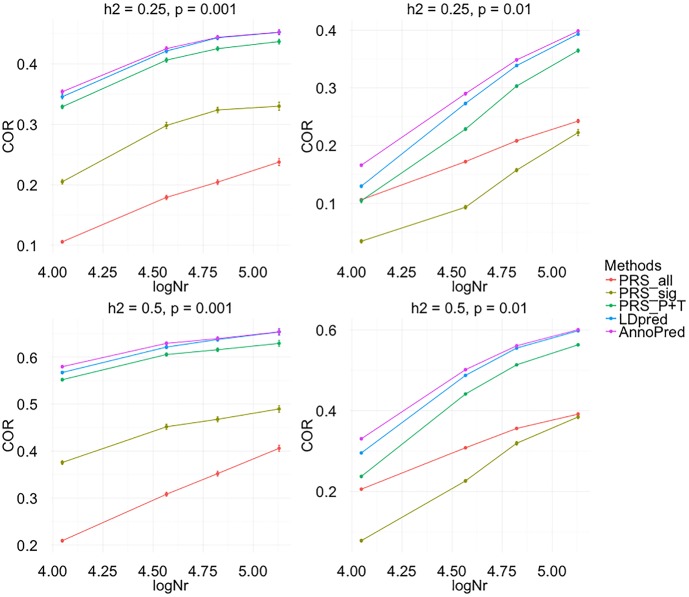
Fig 1. Evaluating the effect of sample size on prediction accuracy in simulation.
Traits were simulated using SNPs of chromosome 1, chromosome 1 and 2, chromosome 1 to 4 and the whole genome while keeping the same proportion of causal variants and heritability to mimic the situation of increasing sample size. In the figure, logNr = , where N is the number of individuals, M is the total number of variants and Ms is the number of variants used in simulation. In total four settings were simulated for each effective sample size: h2 = 0.25, p = 0.001; h2 = 0.25, p = 0.01; h2 = 0.5, p = 0.001; h2 = 0.5, p = 0.01, where p represents the proportion of causal variants. Each dot represent the mean COR of 50 replicates in one simulation setting and error bar represents the standard error.

