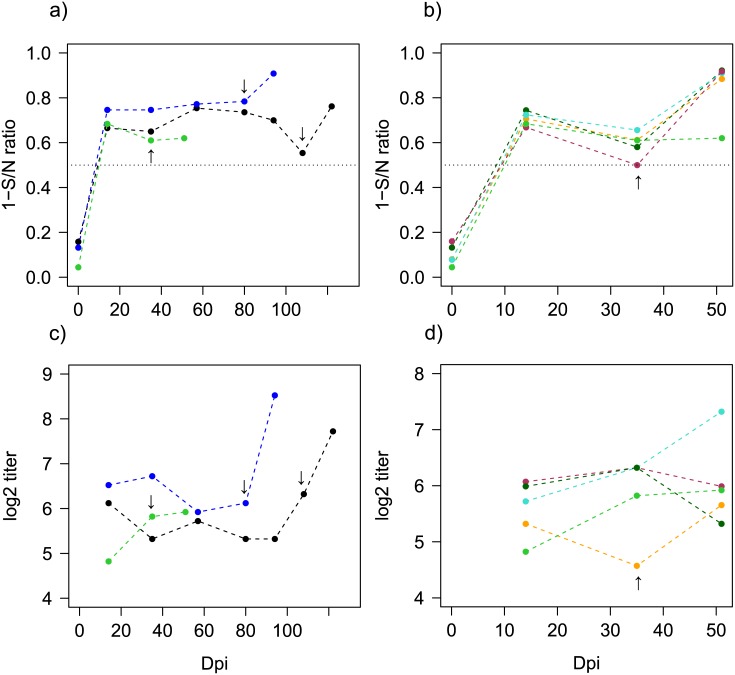
Fig 7. Antibody dynamics for the H3N8 homologous (panels a and c) and heterologous challenges (panels b and d).
Data points indicate the average per group over time. Arrows indicate the timing of re-challenge for the different groups. The different colors indicate groups pre-challenged with H3N8 (green is the group re-challenged after a 5- weeks interval, blue are 11- weeks and black are at 15- weeks) or the different challenge groups: the groups challenged with H4N5 are light blue; H10N7 in orange; H6N2 in red; H12N5 in dark green and H3N8 (homologous challenge for reference) are green. Dashed lines are for H3N8 pre-challenged groups. a) and b) NP-ELISA ratios levels (expressed here as one minus the ratio) c) and d) H3 response by MN (log2 transformed titers) over time.

