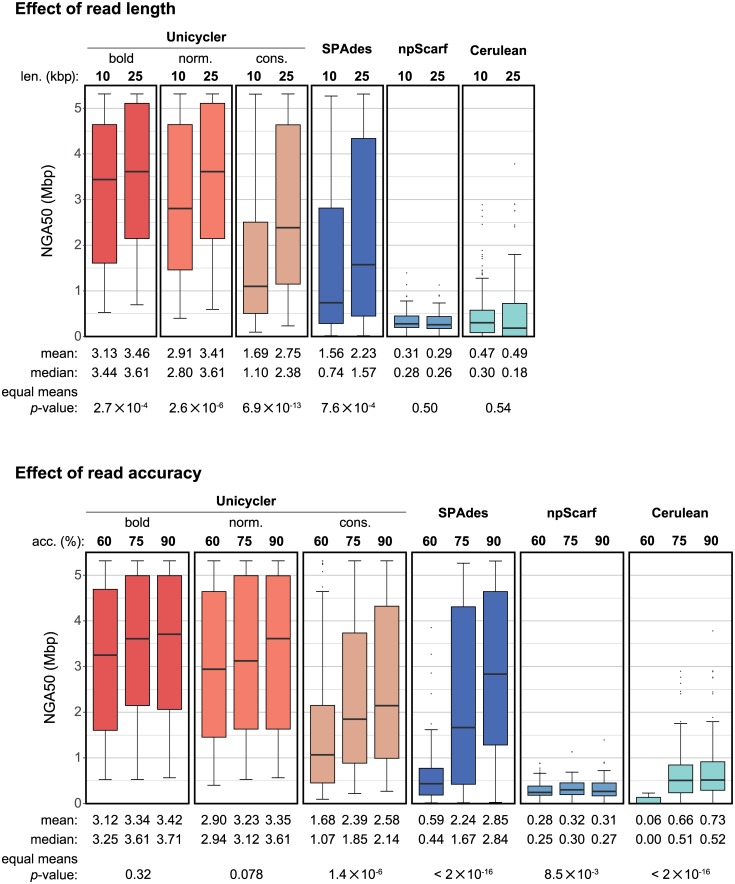
Fig 6. Simulated hybrid assemblies: Read length and accuracy.
NGA50 values segregated by read length and read accuracy. These plots summarise results across all reference genomes and replicate tests, but only include the tests of 8x long-read depth. For read lengths, the p-value is from a two-tailed t-test. For read accuracies, the p-value is from a one-way ANOVA test.

