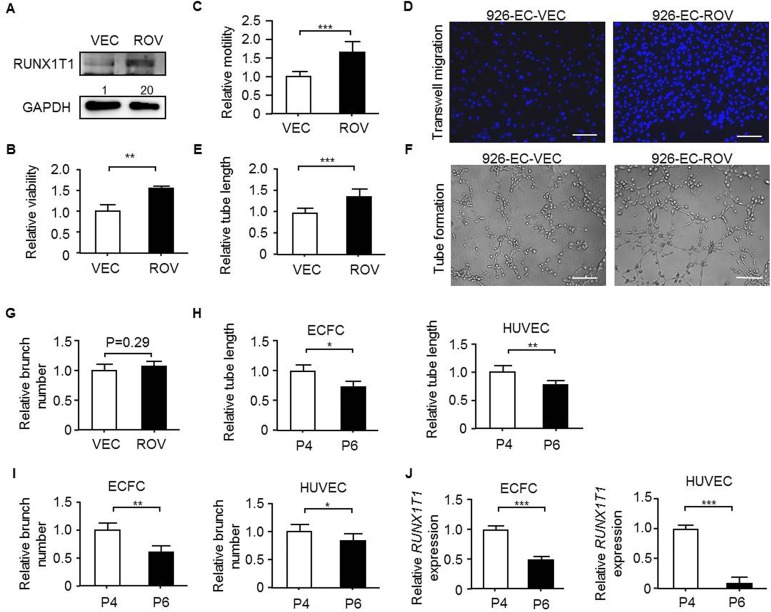
Fig 3. RUNX1T1 is sufficient to enhance angiogenic activity of endothelial cells.
(A) Western blots showing for RUNX1T1 expression levels in 926-EC. VEC, vector control cells; ROV, ectopically RUNX1T1-expressing cells. The band intensity was quantified and normalized to control cells. (B) A histogram showing the relative viability of 926-EC measured by MTT assay. **, p<0.01 (Student’s t test). Data represent mean ± S.D. n = 3 independent experiments. (C) A histogram showing the relative motility of 926-EC. ***, p<0.001 (Student’s t test). (D) Representative images of transwell migration assays. Scale bar = 50 μm. (E) A histogram showing relative capillary formation ability of 926-EC. ***, p<0.001 (Student’s t test). (F) Representative images for the tube formation assays. Scale bar = 50 μm. (G) A histogram showing the relative capillary branch number of 926-ECs. (H) A histogram for showing the relative capillary formation capacity of the ECFCs (left panel) and the HUVECs (right panel) of different passage numbers. P4, the fourth passaged cells; P6, the sixth passaged cells. *, p<0.05; **, p<0.01 (Student’s t test). (I) A histogram for showing the relative capillary branch number of the ECFCs (left panel) and the HUVECs (right panel) of different passage numbers. *, p<0.05; **, p<0.01 (Student’s t test). (J) RT-qPCR results for showing the relative expression levels of RUNX1T1 in ECFCs (left panel) and HUVECs (right panel) of different passage numbers. ***, p<0.001 (Student’s t test).

