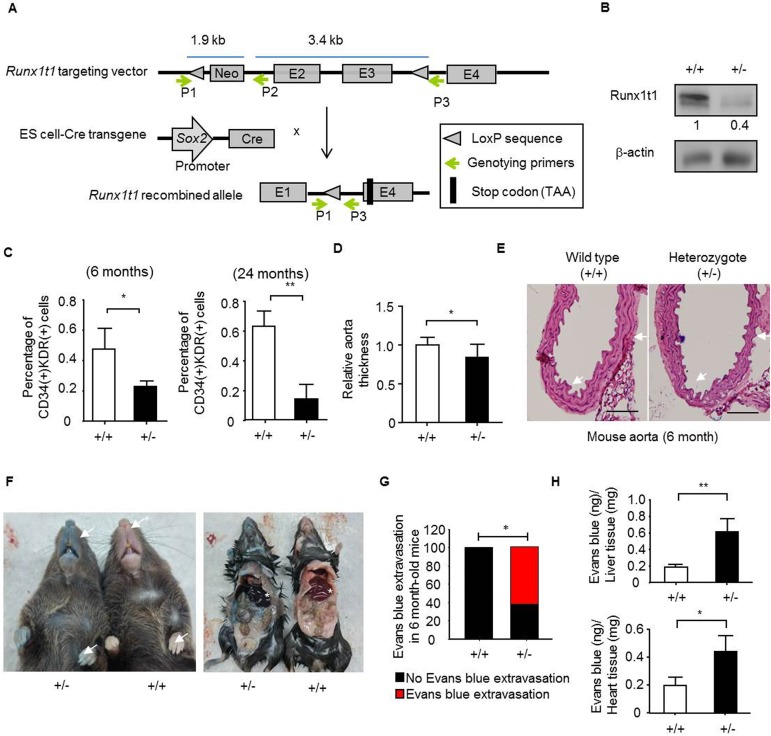
Fig 4. The decreased quantity of bone marrow-derived angiogenic progenitor cells and impaired aorta are observed in Runx1t1 deficient mice.
(A) A schematic representation of the gene-targeting strategy. The P1, P2 and P3 primers were used for the genotyping. The loxP sequence and a FRT-floxed neomycin cassette was introduced into intron 2 and another loxP sequence was inserted into intron 4 to allow Cre-ceconbinase-mediated removal of exons 2 and exon 3. E, exon; Kb, kilobase; Cre, cre-recombinase. (B) A Western blot showing the expression of Runx1t1 in the aorta of 6-month-old wild-type (+/+) and heterozygous Runx1t1 knockout (+/-) mice. The band intensity was quantified and normalized to control cells. (C) The histograms for showing percentage of bone marrow-derived CD34 (+)/KDR (+) angiogenic precursor cells of indicated mice. *, p<0.05 (Student’s t-test); **, p<0.01 (Student’s t-test). Data represent mean ± S.D. n = 4 for each group (D) The quantification of thickness for aorta wall at indicated mice. n = 4 for each group, 6-month-old mice.*, p<0.05 (Student’s t test). (E) The histological images of aortas from indicated mice by hematoxylin and eosin staining. n = 4 for each group. Scale bar = 100 μm. (F). Representative pictures for Evans blue extravasation assay in the 6-month-old wild-type (+/+) and heterozygous Runx1t1 knockout (+/-) mice. Arrows indicated relative location of extravasation observed in heterozygous Runx1t1 knockout (+/-) mice. Star indicated the location of liver. (G) The histogram for showing percentage of aberrant vessel permeability in Runx1t1 deficient mice. n (total mice number used for analysis) = 9 and 8 for 6-month-old wild-type mice (+/+) and Runx1t1 heterozygous mice (+/-), respectively. *, p<0.05, (Fisher’s exact test). (H) The histogram for showing quantification of Evans blue extravasation in liver (upper panel) and heart (lower panel) of Runx1t1 deficient mice (+/-).*, p<0.05; **, p<0.01 (Student’s t-test).

