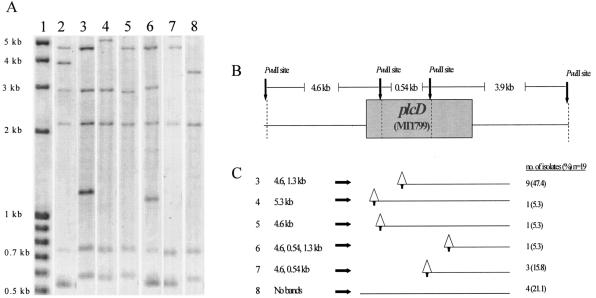
FIG. 1.
Representative patterns of Southern hybridization of the 19 isolates that were negative by the plcD-PCR1 assay. (A) plcD Southern hybridization. Lane 1 contains the molecular size standard, lane 2 contains CDC1551, and lanes 3 through 7 indicate the five different banding patterns having bands that are plcD specific. The sizes of the plcD-specific bands in lanes 3 through 7 are shown in panel C. In lane 8, no plcD-specific band was detected. (B) PvuII restriction map of the plcD gene region and the expected restriction fragment size for CDC1551. (C) Hypothetical map of IS6110 insertion and associated deletion generated based on the analysis of the observed plcD band size. Triangles represent the positions of the IS6110 insertions predicted by Southern hybridization, and lines extending from the triangles represent the predicted deletion of unknown length. The arrows on the bottoms of the triangles represent the PvuII restriction site that is contained within the IS6110 sequence.

