
Fig. 2.
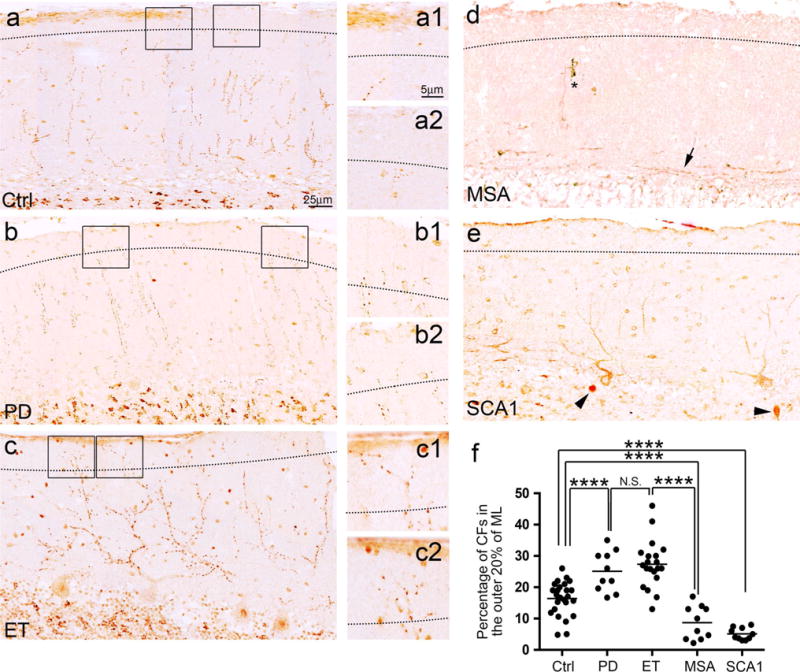
CFs in the outer portion of the molecular layer in the cerebellar cortex of tremor and cerebellar degenerative disorders. The dotted line indicates the border between the outer 20 % and inner 80 % of the molecular layer (a–e). Representative cerebellar sections of a control (a), a PD case (b), an ET case (c), an MSA case (d), and an SCA1 case (e) labeled with anti-VGlut2 antibodies are shown. The square areas are shown at higher magnification, to the right of each panel (a–c), and demonstrate that an ET case and a PD case have an increased number of CFs passing the dotted line as compared to a control. Representative cerebellar sections of an MSA case (d) and an SCA case (e) demonstrate that the CFs regressed from the outer portion of the molecular layers. Abnormal CFs parallel to the PC layer (d, an arrow) and a dystrophic CF (d, asterisk) can be observed in the MSA case. Torpedoes are seen in the SCA1 case (e, arrowheads). When compared to controls, ET cases and PD cases have a significantly increased percentage of total CF profiles extending into the outer 20 % of the molecular layer, whereas this pathology is markedly decreased in MSA cases and SCA1 cases. Ctrl control, PD Parkinson’s disease, ET essential tremor, MSA multiple system atrophy, SCA1 spinocerebellar ataxia type 1, CF climbing fiber. NS non-significant, ****p < 0.001