
Figure 3.
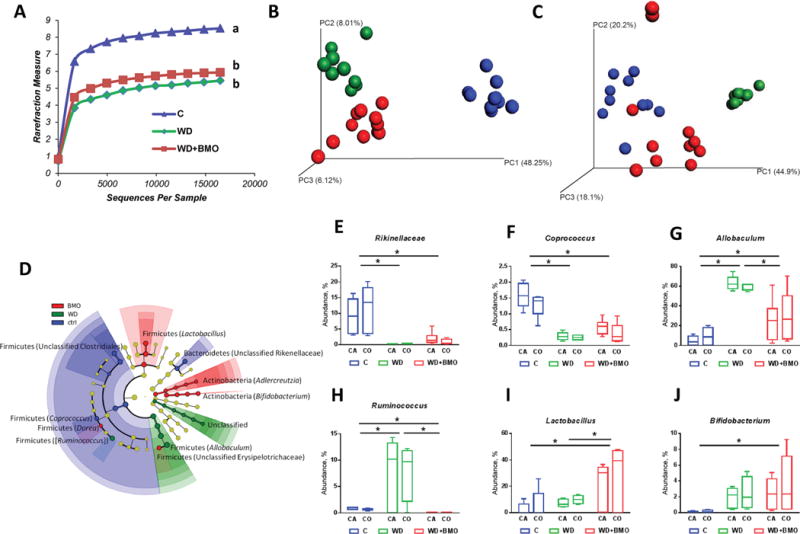
Cecal and colonic microbiota. Rarefaction curves (A), unweighted (B) and weighted (C) UniFrac analysis, significant changes in relative genus abundance (D) and average relative abundance of Rikinellaceae (E), Coprococcus (F), Allobaculum (G), Ruminococcus (H), Lactobacillus (I), and Bifidobacterium (J) in cecal (CA) and colonic (CO) microbiota of mice fed a control chow (C; blue) or Western diet (WD) for 7 wk (green) or WD for 5 wk followed by WD supplemented with bovine milk oligosaccharides (WD+BMO) for 2 wk (red). Whisker plots: minimum to maximum with median. Curves with different letters are significantly different. * denotes a significant difference (P < 0.05).