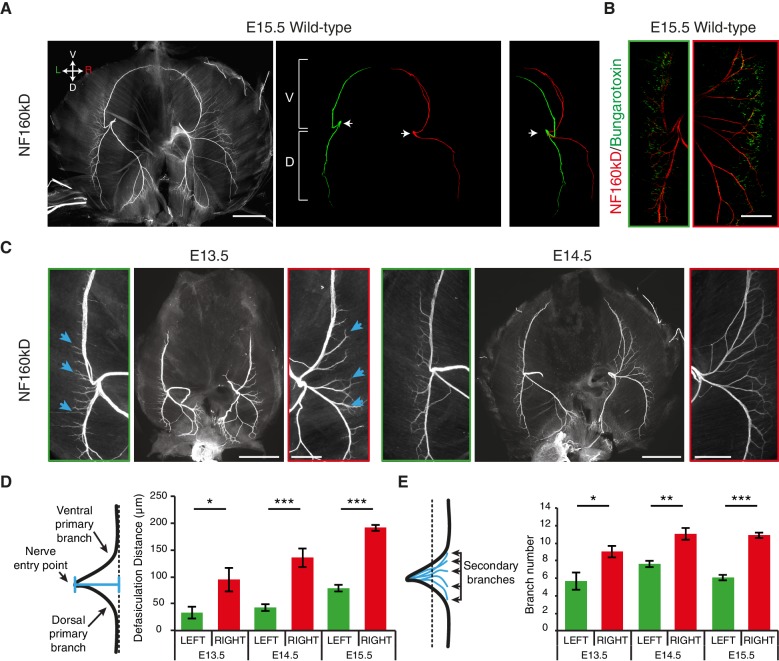
Figure 1. L/R asymmetries of the phrenic nerve patterns are established from the onset of diaphragm innervation.
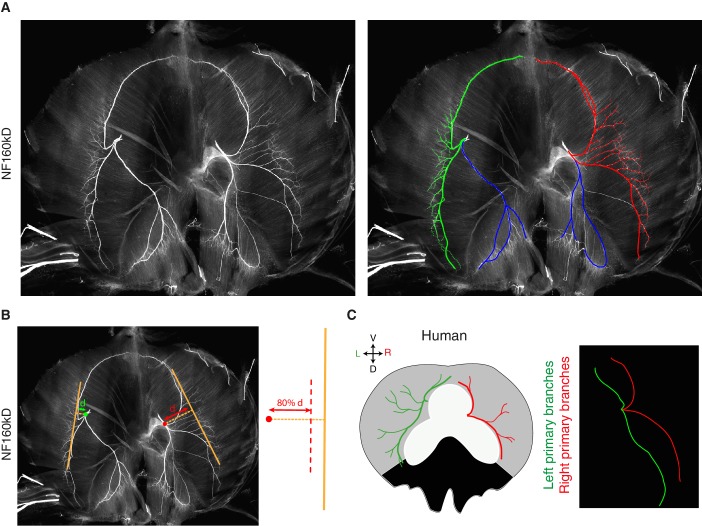
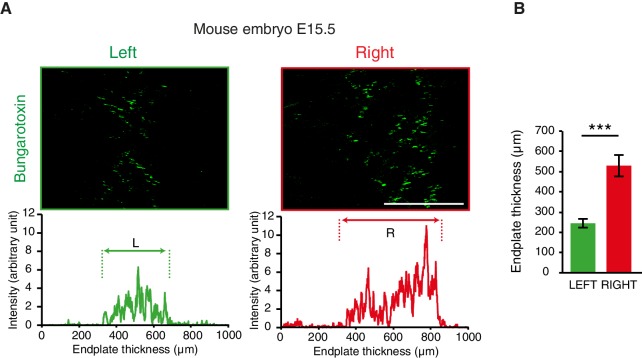
(A) Neurofilament (NF) staining showing the branching patterns of the left and right phrenic nerves in whole-mount E15.5 mouse diaphragm. Left and right primary branches are pseudocolored (middle panel) in green and red, respectively. (See Figure 1—figure supplement 1A, for complete branch traces). L/R asymmetry is especially apparent after superimposing the left and right primary branches (right panel). Arrows point to the nerve entry points. Images are top views of the whole diaphragm, oriented as indicated in the top left hand corner of the left panel (V, Ventral; D, Dorsal; L, Left; R, Right). (B) NF and Bungarotoxin staining showing the asymmetry of acetylcholine receptor clusters and nerve domains on the left (left panel, green frame) and right (right panel, red frame) diaphragm muscles of an E15.5 embryo (see Figure 1—figure supplement 2 for quantification). (C) NF staining showing the patterns of left and right phrenic nerves at E13.5 and E14.5. Green- and red-framed panels show enlarged images of the left and right phrenic nerves, respectively. (D) Schematics showing the method used to quantify the defasciculation distance (shown in blue), from the nerve entry point to the dotted line and histogram of the defasciculation distance at E13.5, E14.5 and E15.5 (E13.5 — left 32.76 ± 11.01, right 94.82 ± 21.94, N = 9, p=0.0106; E14.5 — left 42.56 ± 4.16, right 135.71 ± 10.20, N = 8, p=0.00015; E15.5 — left 77.16 ± 7.32, right 188.51 ± 7.01, N = 18, p=4 E-10, Mann-Whitney). (E) Schematics showing the method used to quantify the secondary branch number by counting the number of NF-positive fascicles that crossed the dotted line positioned at 80% of the defasciculation distance and histogram of the secondary branch number at E13.5, E14.5 and E15.5 (E13.5 — left 5.55 ± 0.96, right 8.88 ± 0.65, N = 9, p=0.0288; E14.5 — left 7.5 ± 0.38, right 10.88 ± 0.69, N = 8, p=0.00117; E15.5 — left 5.94 ± 0.31, right 10.7 ± 0.3, N = 18, p=2.35 E-7, Mann-Whitney). Histograms show the mean ± SEM for each stage. Scale bars: 200 μm (A,C); 100 μm (B). Numerical values used to generate the graphs are accessible in Figure 1—source data 1.
DOI: http://dx.doi.org/10.7554/eLife.18481.003


