. 2017 Jun 22;6:e18481. doi: 10.7554/eLife.18481

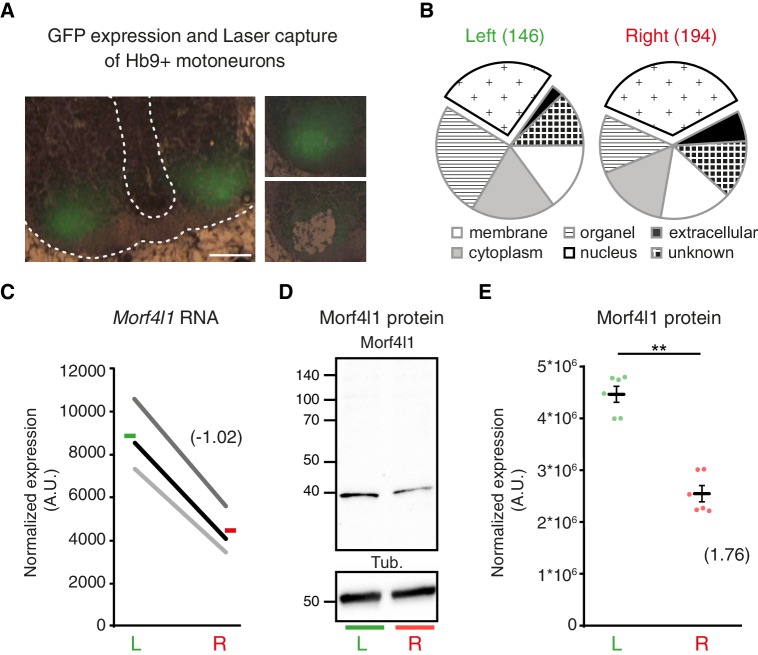
Figure 4. L/R molecular signature of cervical motoneurons.

(A) Transverse sections of E11.5 Hb9::GFP embryo cervical spinal cord, illustrating the areas used for laser-capture microdissection. (B) Pie charts showing the proportion of left-enriched and right-enriched genes according to their Gene Ontology ‘cellular component’ terms. The ‘nucleus’ component is detached from the pie. (C) Ladder graph showing the left and right expression of Morf4l1 in three embryos. Average L/R fold-change shown in brackets. (D) Immunodetection of Morf4l1 and loading control tubulin (Tub.) in left and right ventral cervical spinal cord tissues. (E) Graph showing normalized protein levels of Morf4l1 in left and right ventral cervical spinal cords from E11.5 mouse embryos. Individual values observed for the six western-blots (dots) and mean ± SEM are represented (L/R ratio: 1.81 ± 0.163, L versus R; p=0.0022, Wilcoxon signed rank). Average L/R fold-change shown in brackets. Scale bar: 100 μm. Numerical values used to generate the graphs are accessible in Figure 4—source data 3.

DOI: http://dx.doi.org/10.7554/eLife.18481.016

Figure 4—source data 1. List of enriched genes in the left cervical motor neurons of HB9::GFP embryos at E11.5.
Genes are included on this list if the average change in expression was > 1.5 (or −0.58< in log2) between the left and right sides. The listed genes had the same enrichment trend in all embryos with a fold-change > 1.5 in at least in two embryos.
DOI: 10.7554/eLife.18481.017
Figure 4—source data 2. List of enriched genes in the right cervical motor neurons of HB9::GFP embryos at E11.5.
Genes are included in the list if the average change in expression was > 1.5 (or > 0.58 in log2) between the right and left sides. The listed genes had the same enrichment trend in all embryos with a fold-change superior to 1.5 in at least in two embryos.
DOI: 10.7554/eLife.18481.018
Figure 4—source data 3. Lateralization expression of Morf4l1 in cervical motoneurons.
This file provides the statistical reports and individual values used to create the ladder graphs shown in Figure 4C and E. RNA expression is shown on the first sheet. Normalized protein levels are shown on the second sheet.
DOI: 10.7554/eLife.18481.019

Figure 4.

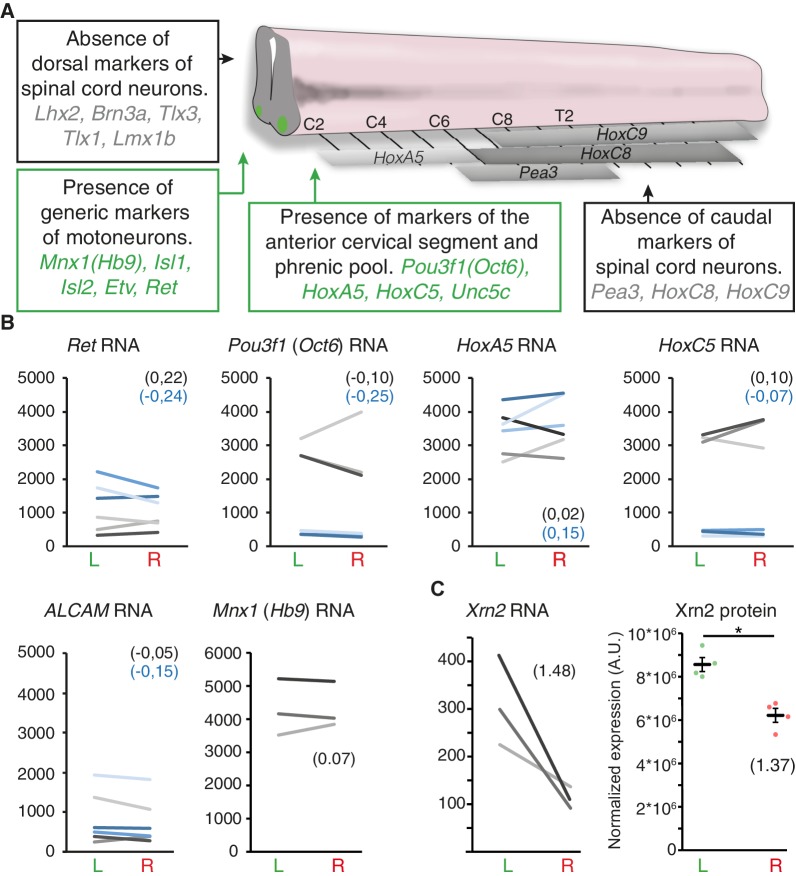
Figure 4—figure supplement 1. Symmetric expression of phrenic motoneuron markers, and lateralized Xrn2 expression.

Figure 4—figure supplement 1.

(A) Schematic representation of the spinal cord that depicts the expression domain of Hox genes and brachial-specific Pea3 (Etv4) transcription factor. Boxes represent present/absent call tests indicating that markers of dorsal spinal cord and brachial motoneurons are absent. By contrast, generic markers of motoneurons as well as markers that are enriched in cervical and phrenic motoneurons are present in all three embryos. (B) Ladder graphs showing the normalized expression signals in the left and right laser-captured samples of the three embryos for probes that detect Ret, Pou3f1 (Oct6), HoxA5, HoxC5, ALCAM and Mnx1 (Hb9) RNA. The average log2 (R/L ratios) are indicated in brackets in black for probe one and blue for probe 2. None of these probes showed significant L/R difference according to the threshold used (see Materialsand methods). (C) Ladder graph of Xrn2 RNA expression in left and right samples from the three embryos (left panel), average log2 (R/L ratio) indicated in brackets. Graph showing the left and right normalized protein levels of Xrn2 in ventral cervical spinal cord from E11.5 embryos. Values of the four western-blots (dots) and mean ± SEM are represented (L/R fold-change 1.37 ± 0.13, L versus R, p=0.028; Mann-Whitney) (right panel). Numerical values used to generate the graphs are accessible in Figure 4—figure supplement 1—source data 1.
Figure 4—figure supplement 1—source data 1. RNA level of motoneuron markers and asymmetric expression of Xrn2.
This file provides the individual values used to create the ladder graphs shown in Figure 4—figure supplement 1B and C. RNA expression of motoneuron markers is shown on the first sheet. RNA and normalized protein levels of Xrn2 are shown on the second and third sheets.
DOI: 10.7554/eLife.18481.021