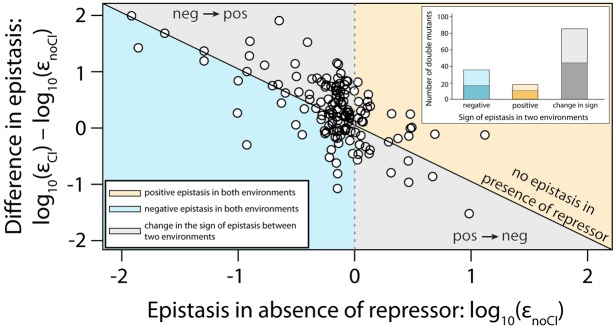
Figure 4. Sign of epistasis changes with the environment for most double mutants.
Points show the log10 value of epistasis in the absence of repressor, and the difference in the log10 value of epistasis in the presence and the absence of repressor: log10 (εCI) – log10 (εnoCI), for all 141 double mutants. Points above the solid diagonal line exhibit positive, while points below exhibit negative epistasis in the presence of the CI repressor. Most mutants have a different sign of epistasis between the two environments (gray area). Bar chart shows total number of double mutants that are always in positive (orange) or in negative (blue) epistasis, and the total number that changes sign between the two environments (gray). The darker areas in the bars represent the number that are significantly different from the null expectation of the model (no epistasis) in both environments. Six replicates of each mutant were measured. The data presented in this figure is calculated from Figure 3—source data 1.

