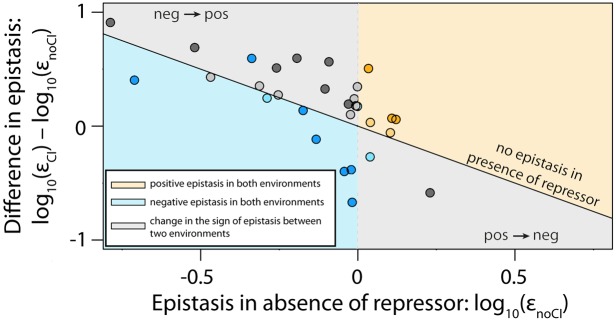
Figure 6. The thermodynamic model accurately predicts sign of epistasis and its environment-dependence.
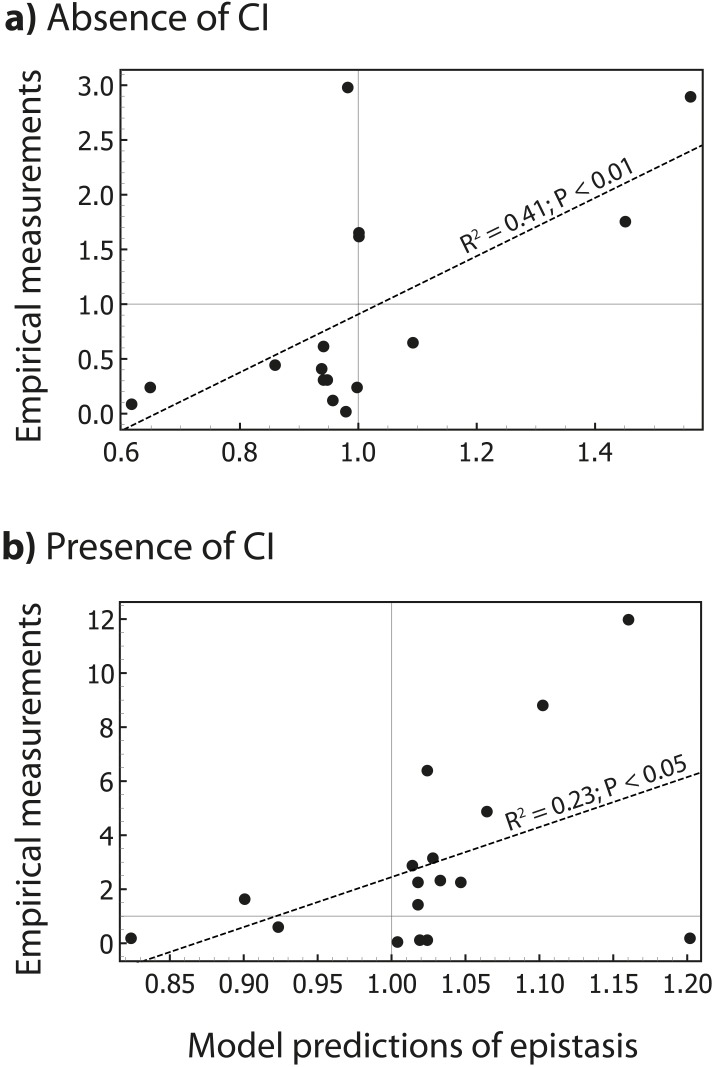
In order to conduct an independent test of the assumptions of the generic model, we expanded the generic model to include specific information about the two TFs relevant to the experimental system – namely, the energy matrices for RNAP (Kinney et al., 2010) and CI (Sarai and Takeda, 1989). We could not use the 141 random mutants to validate the model, as most of them contained mutations that were in the regions of the CRE that were poorly characterized by the energy matrices. Therefore, using the energy matrices, we had to create a new library consisting of five random double mutants for each category from Table 1. As we could not identify any single point mutations that simultaneously improved the binding of both RNAP and repressor, we tested if empirical measurements of epistasis conformed to model predictions in 30 mutants. The model predictions of the sign of epistasis and its environment dependence were based only on the sign of individual mutation effects on RNAP and repressor binding. The location of points corresponds to the experimental measurement of epistasis for each mutant, while the color indicates the model prediction: (i) blue - double mutants predicted to be in negative epistasis both in the absence and in the presence of the repressor CI; (ii) orange - double mutants that are always in positive epistasis; (iii) grey - double mutants predicted to change the sign of epistasis in the two environments. The color intensity indicates significance – lighter shades represent non-significant, darker shades represent significant epistasis in both environments (see ‘Empirical verification of the thermodynamic model’ section in Online Methods). Six replicates of each mutant were measured. The data underlying this figure is presented in Figure 6—source data 1. The quantitative test of how well the thermodynamic model predicts the magnitude of epistasis in this dataset is presented in Figure 6—figure supplement 1.
DOI: http://dx.doi.org/10.7554/eLife.25192.013


