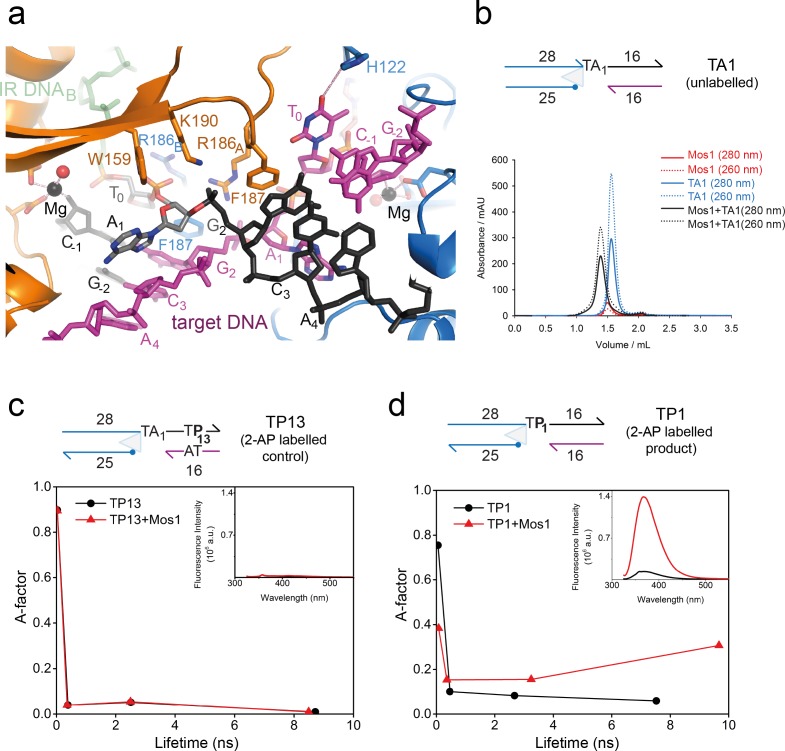
Figure 3. Dynamic base flipping of the target adenines.
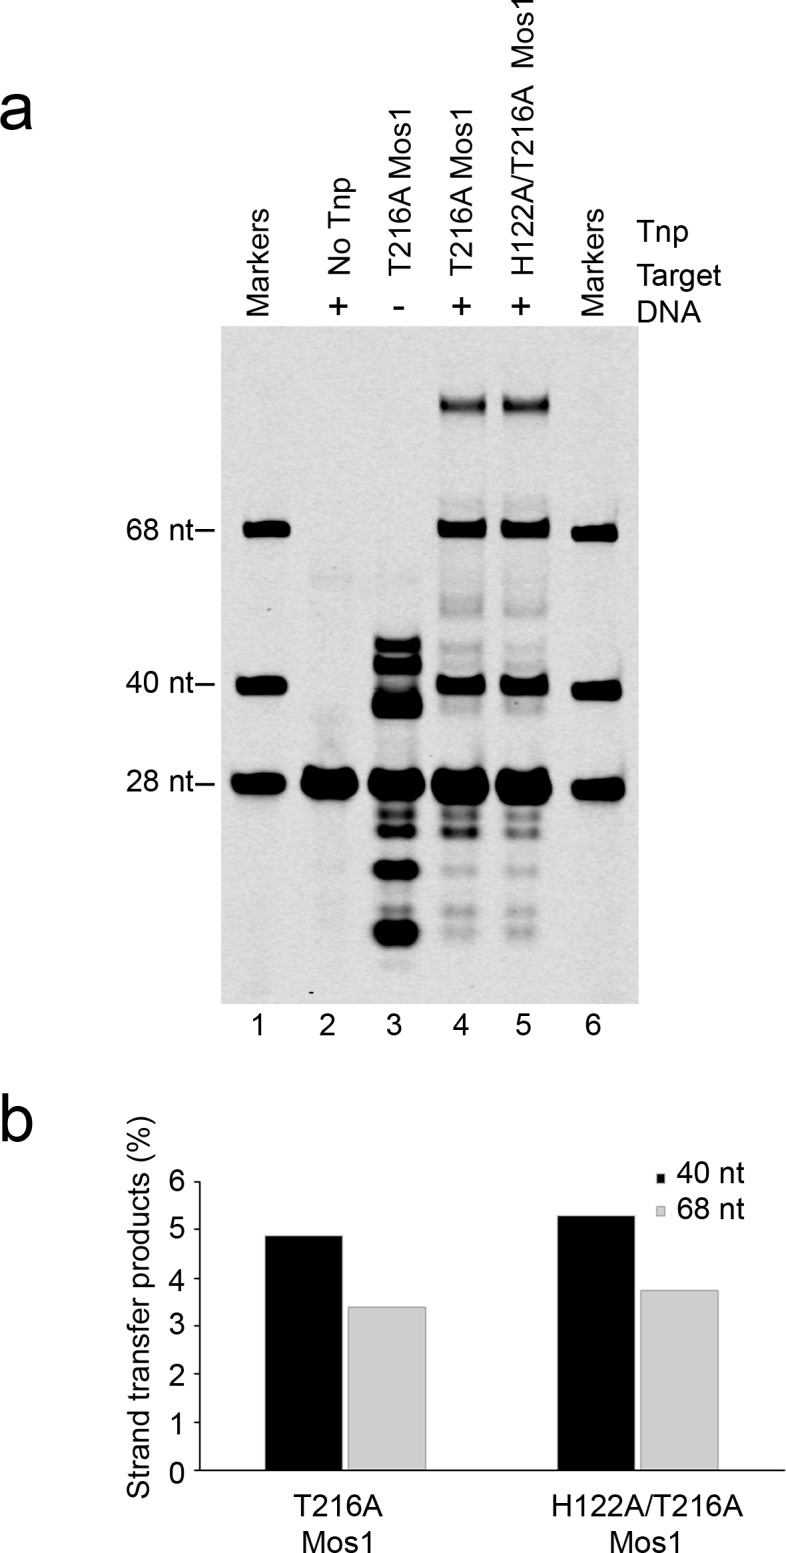
(a) Target DNA binding in the Mos1 STC, showing the flipped A1 conformation. The unpaired T0 base stacks with the C-1 base of the same strand. See Figure 3—figure supplement 1 for the effect on strand transfer activity of the mutation H122A. (b) Schematic of the TA1 DNA duplex and gel filtration chromatograms of Mos1 transposase (red), TA1 (blue) and the STC (black). UV absorbance at 280 nm (solid line) and 260 nm (dotted line). (c and d) Fluorescence spectroscopy of the 2AP-labelled DNA oligonucleotides TP13 and TP1, shown schematically in (c) and (d) respectively. The A-factor (fractional population) and lifetime of each of the four fluorescence decay components are plotted for TP13 and TP1 alone (black circles and lines) and in the presence of Mos1 transposase (red triangles and lines); and tabulated in Figure 3—source data 1. The steady-state fluorescence emission spectra are inset in each case.
DOI: http://dx.doi.org/10.7554/eLife.15537.010
Figure 3—figure supplement 1. Strand transfer assay comparing the activity of T216A and H122A/T216A Mos1 transposases.


