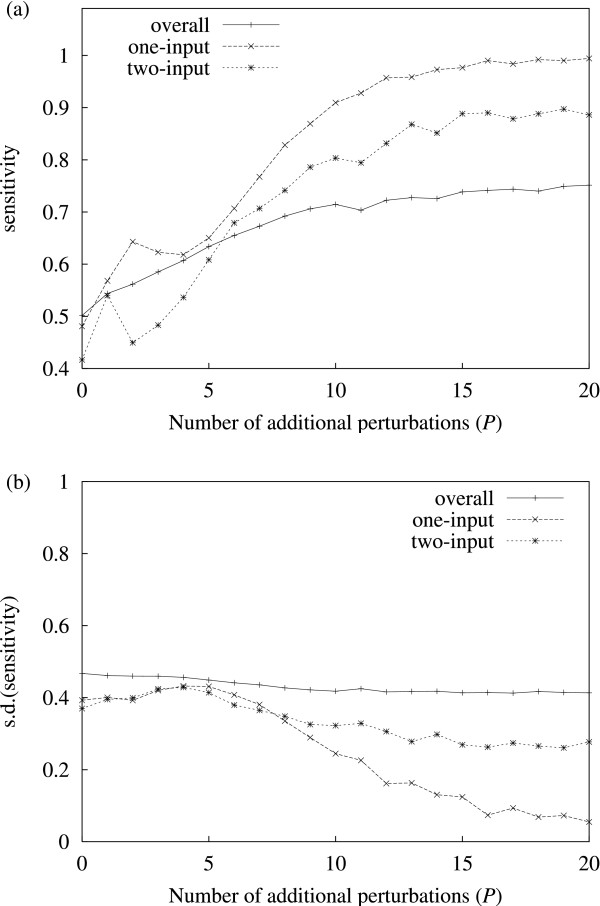
Figure 1.

Sensitivity vs. P. (a) Sensitivity vs. number of additional perturbations used. (b) The corresponding standard deviation is shown here separately for clarity. The curves represent results for overall (i.e. all solutions) sensitivity, and specific sensitivity for (predicted) one and two-input solutions. Sensitivity is generally lower for higher order of inputs. Accuracy increases significantly with the number of additional perturbations used. The results shown are average values for 250 random networks at each data point. The remaining parameters are fixed: network size N = 50, perturbation intensity q = 0.5.
