Figure 2.

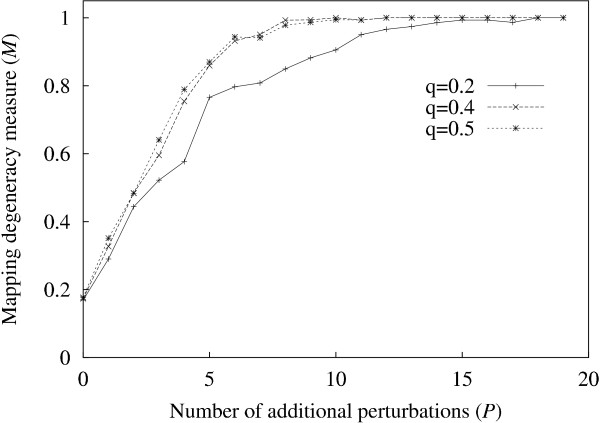
M vs. P. M (the number of distinct "concatenated" vectors Si divided by N, the number of genes) increases in value, as the number of perturbations (P) is increased. The graph shows curves for three values of perturbation intensity q.

M vs. P. M (the number of distinct "concatenated" vectors Si divided by N, the number of genes) increases in value, as the number of perturbations (P) is increased. The graph shows curves for three values of perturbation intensity q.