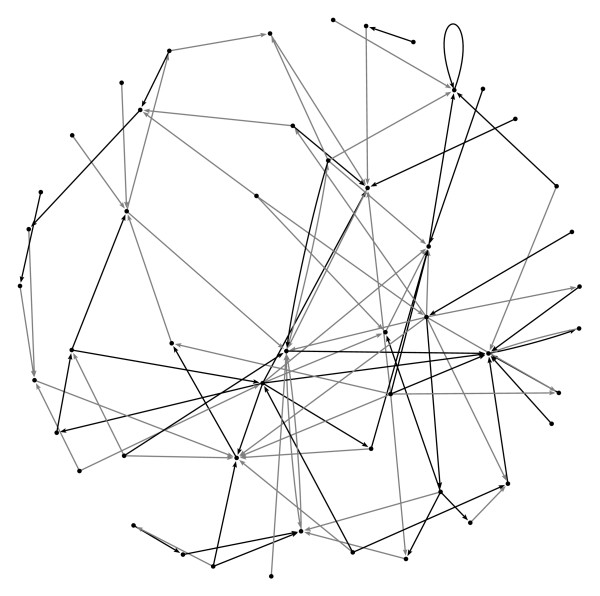
Figure 5.

Example network. Example of an artificial gene network with N = 50. Positive interactions are shown in black, negative interactions in grey. Note the autoregulatory interaction on the upper right hand side. This diagram was generated using Pajek http://vlado.fmf.uni-lj.si/pub/networks/pajek/.
