Figure 1.

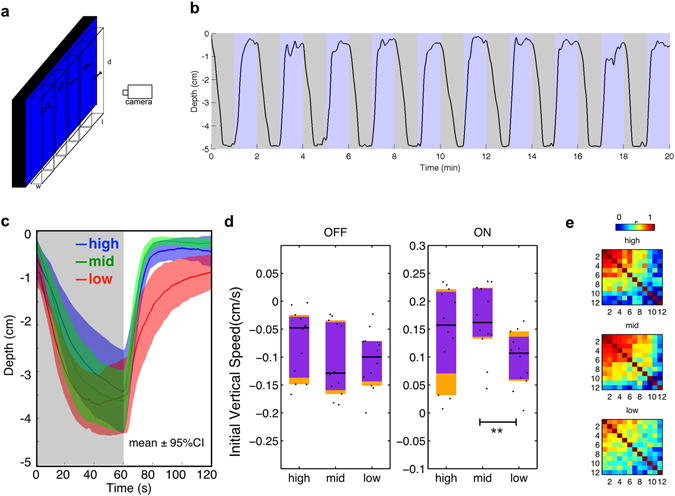
Blue light masks vertical migration. (a) Schematic of the assay. Larval zebrafish were placed individually in tanks in front of an LED backlight. (b) Response of 1 fish to ten cycles of blue (470 nm) light and darkness. (c) Depth of larvae across time under different intensities of blue light, averaged from 10 cycles. n = 12 for each group. Shadows indicate 95% confidence intervals (CIs). Mid-intensity 600 µW/cm2, high-level 6000 µW/cm2 and low-level is ~6 µW/cm2. The photon intensity of mid-level is at the level of 1015 cm−2 s−1. (d) Comparison of averaged initial 20 s vertical speed under different intensities of blue light. Horizontal black lines indicate median values, black dots show individual speeds, orange blocks show 95% CIs and purple blocks indicate the 25th and 75th percentiles. (e) Correlation coefficients of vertical position across time during 10 dark-light cycles under different intensities of light. Correlation matrices are different (mid vs high: χ 2 = 6519, df = 66, p < 0.0001; mid vs low: χ 2 = 3963, df = 66, p < 0.0001. Jennrich’s χ 2 test45). For n = 3 groups, Bonferroni correction α = p/n = 0.05/3 = 0.0167.
