Figure 4.

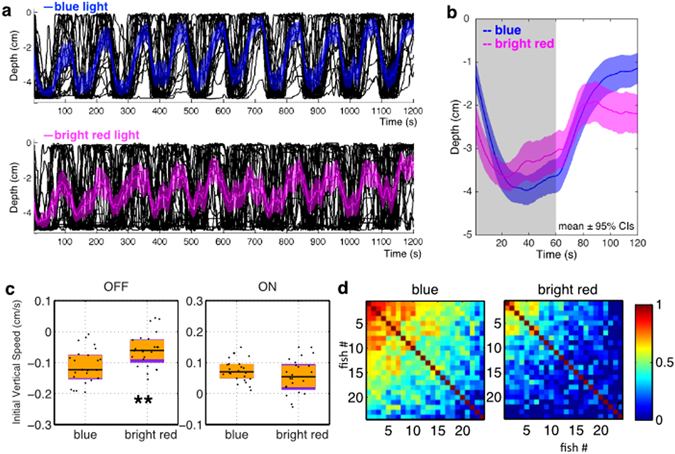
Blue and red light have different effects on vertical migration. (a) Vertical migration of fish under blue light and red light of ten-fold higher intensity: ~1.56 × 1015 cm−2 s−1 for blue light, and ~1.6 × 1016 cm−2 s−1 for red light. Black lines represent individual fish, and colored traces represent the average. Shadows indicate 95% CIs. Blue, 470 nm, 650 µW/cm2; red, 660 nm, 4650 µW/cm2. N = 24 for each group. (b) Averaged vertical migration from 10 dark-light cycles, averaged from panel. (a) Represented as mean ± 95% CIs. The curve under red light of high intensity is different from the one under blue towards the end of the light ON period. (c) Initial 20 s vertical swimming speed. Initial diving speeds upon light offset are different (Mann-Whitney U = 145, **p = 0.004, two tailed, rank-biserial correlation = 0.50). Initial climbing speeds upon light onset are similar (Mann-Whitney U = 231, p = 0.24, two tailed, rank-biserial correlation = 0.20). Horizontal black lines indicate median values, black dots show speed of individual fish, purple blocks show the 25th and 75th percentiles and orange blocks show 95% CIs. (d) Correlation coefficient of vertical position across time during 10 dark-light cycles. Correlation matrices are significantly different (χ 2 = 12975, df = 276, p < 0.0001. Jennrich’s χ 2 test). Correlation coefficients are lower under red light of high intensity compared to blue light (median r = 0.45 for blue, 0.15 for red; U = 2803, ***p < 0.0001, one tailed Mann-Whitney U test).
