
Figure 2.
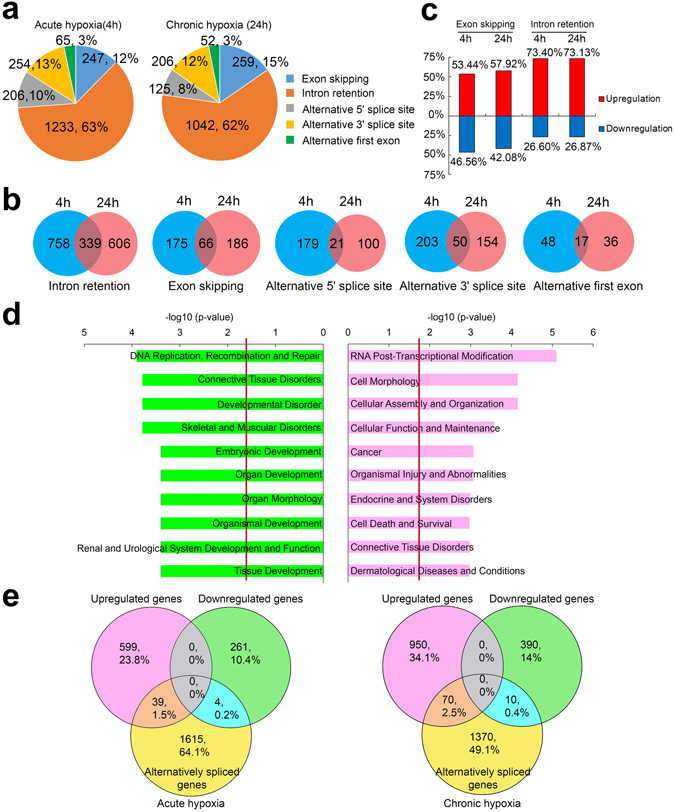
Hypoxia drives alternative splicing in MCF7 cells. (a) Pie charts showing the occurrence of 5 classes of alternative splicing events that are induced during acute and chronic hypoxia as identified from n = 1 RNA-Seq experiments. A FDR of < 0.01 and |ΔSI| of ≥ 15% was used as the cutoff. (b) Venn diagrams showing the overlap for the 5 types of significantly regulated alternative splicing events during acute and chronic hypoxia. The number of splicing changes and the corresponding percentage out of the total is indicated. (c) Bar chart shows the percentage of up- and downregulated exon skipping and intron retention events in acute and chronic hypoxia. (d) GO analysis using IPA for significantly down- and upregulated intron retention events (FDR < 0.01 and |ΔSI| ≥ 15%) during chronic hypoxia. Red lines indicate the p-value cutoff of 0.05 for Fisher’s exact test. (e) Venn diagrams showing overlaps between genes that are up- or downregulated by at least 1.5-fold and genes undergoing alternative splicing (|ΔSI| ≥ 15%) during acute and chronic hypoxia in MCF7 cells. The number of alternatively spliced genes is less than the number of alternatively spliced events as some genes may be subjected to multiple splicing events.