
Figure 5.
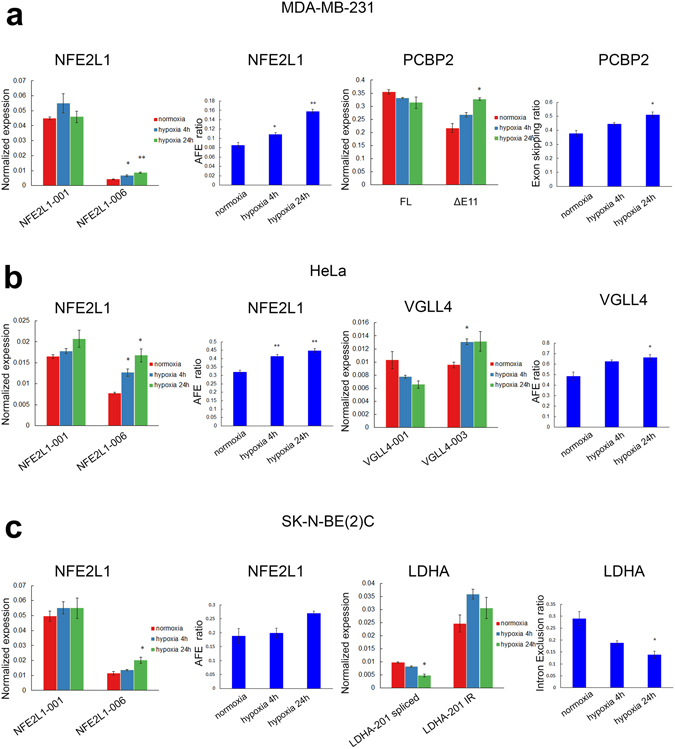
Conservation of hypoxia-induced alternative splicing in MDA-MB-231, HeLa and SK-N-BE(2)C cells. (a) Normalized expression of alternative first exon (AFE) usage NFE2L1 and exon skipping PCBP2 isoforms in MDA-MB-231 cells was measured by qRT-PCR. (b) Normalized expression of AFE NFE2L1 and VGLL4 isoforms in HeLa cells was measured by qRT-PCR. (c) Normalized expression of AFE NFE2L1 and intron retention LDHA isoforms in SK-N-BE(2)C cells was measured by qRT-PCR. In all 3 cell lines, the relative abundance of alternatively spliced isoforms was calculated as a percentage of the total abundance for all isoforms using the qRT-PCR results (blue bar charts). PPIA expression levels were used as the housekeeping reference control. All qRT-PCR analysis was performed with three biological replicates (n = 3). Error bars indicate SEM. Statistical significance was evaluated with Student’s t-test. *indicates p-value < 0.05, **indicates p-value < 0.01.