Figure 6.
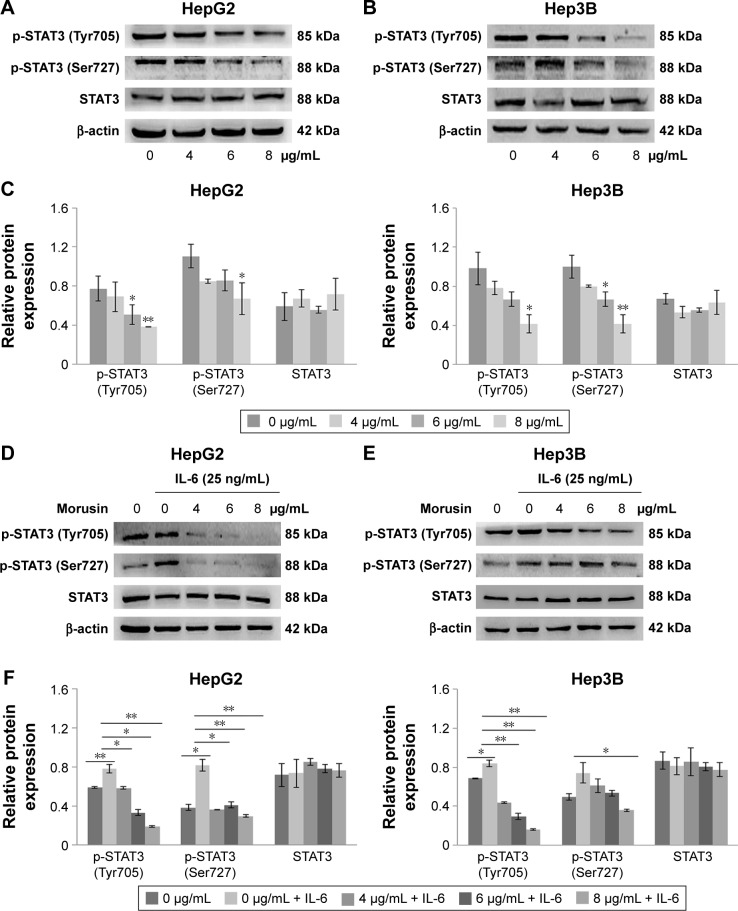
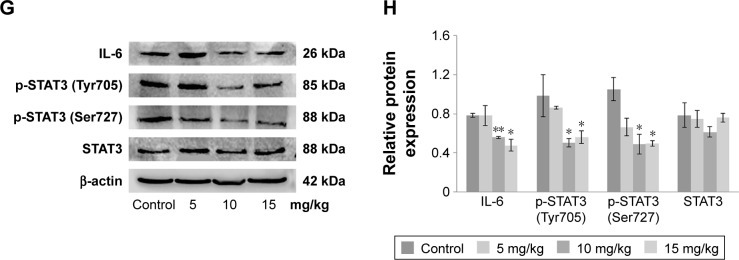
The effect of morusin on protein expressions of the IL-6/STAT3 signaling pathway.
Notes: HepG2 cells (A) or Hep3B cells (B) were treated with the indicated concentrations of morusin for 48 h and analyzed for p-STAT3 (Tyr705), p-STAT3 (Ser727), and STAT3 levels using Western blot analysis. (C) The histograms show that there was a significant decrease in p-STAT3 (Tyr705) and p-STAT3 (Ser727) but not in the total STAT3 expression after morusin treatment. (D, E) HCC cells were treated with the indicated concentrations of morusin for 24 h and were then induced by IL-6 for 15 min, after which whole-cell extracts were processed for Western blot analysis. (F) The histograms show that there was a decrease in p-STAT3 (Tyr705) and p-STAT3 (Ser727) but not in the total STAT3 expression after morusin treatment. (G) Western blot analysis of protein expressions in the IL-6/STAT3 signaling pathway in morusin-treated tumor tissues. (H) The histogram shows that expression levels of IL-6, p-STAT3 (Tyr705), and p-STAT3 (Ser727) decreased. *P<0.05, **P<0.01. Three parallel experiments were performed.
Abbreviation: HCC, hepatocellular carcinoma.


