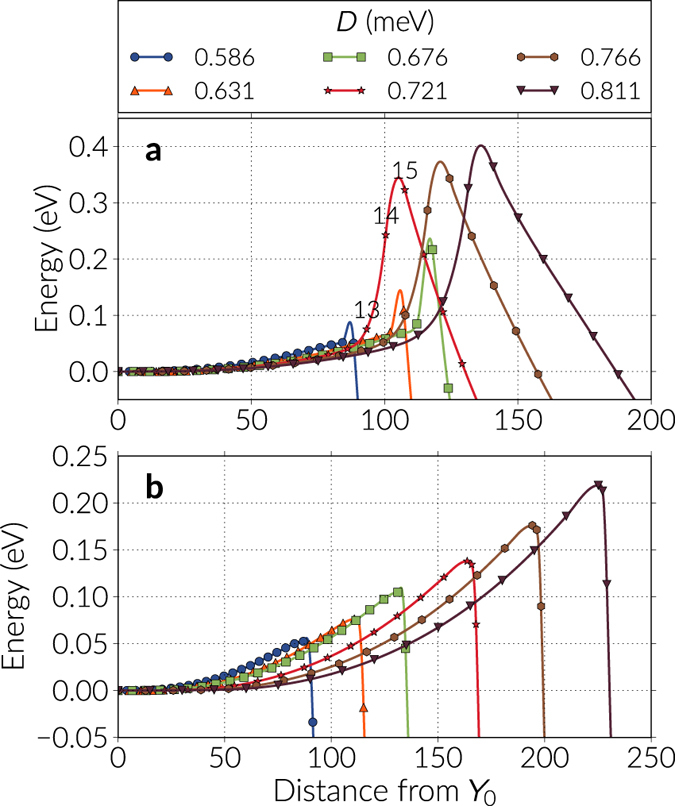
Figure 6.

Energy bands for two skyrmion destruction mechanisms. The bands are shown for different DMI constant D and only for the first few images of the bands. The first or extreme left image is the skyrmion configuration and for every case, the energy is redefined with respect to the skyrmion energy. The continuous line is a cubic polynomial interpolation. (a) The energy bands obtained with the NEBM. The curves for DMI values of D = 0.676 meV and below, are the skyrmion collapse. For values of D = 0.721 meV and above, the bands are the skyrmion destroyed by a Bloch point like singularity. (b) Refined energy bands obtained with the Climbing Image NEBM applied to the largest energy points of the curves in Figure (a). We expect the data in (b) to be a better approximation of the energy barrier. For this case, all the bands converged towards the skyrmion collapse path.
