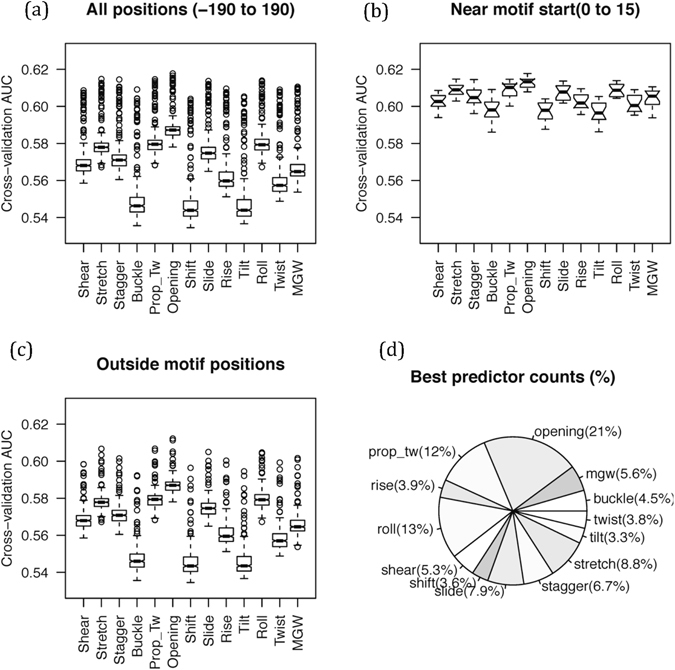
Figure 4.

Ability of single parameter conformational ensembles to predict TFBS in PIQ data. (a) TFBS’s were classified from genomic control positions using 65 ensemble features at motif site and its +/−200-nt distance using 7-nt window at each position in each of the 1312 TFs and distribution of AUC for all such predictions was represented in a boxplot. (b) The data were separated for motif positions (0 to 15 bases from motif start) and (c) outside of it. Results in (a–c) indicated that “opening” ensemble is the best predictor of TFBS in both regions (even if the difference between AUC is small), followed by parameters whose static values are also used in DNAshape (see (d)) (d) Relative number of times a conformational parameter appeared in the top-ranked position in all positions in all TFs was counted.
