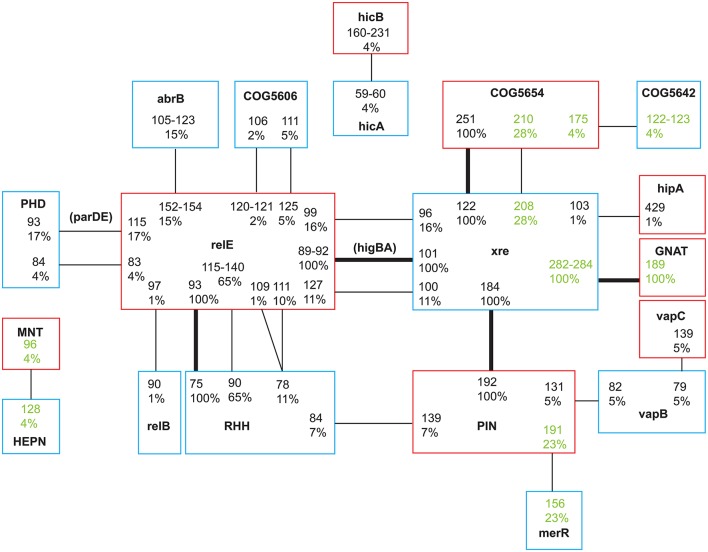
Figure 1.
Network of toxin and antitoxin associations categorized by family or domain type. Toxins are marked with red and antitoxins blue. Each TA pair is denoted by a number giving the length of the protein in amino acids and the prevalence in the study population in %. Lines mark the connection between a toxin and its antitoxin. Bold lines mark TA systems found in the core genome of all isolates. Two TA pairs were named by Pandey and Gerdes (2005), these names are denoted in parentheses. Pairs identified by TAfinder but not verified by BLASTP analysis are highlighted in green. Seven unique TA pairs were only found in one environmental isolate (Tables S1, S3) and are not included in the figure.

