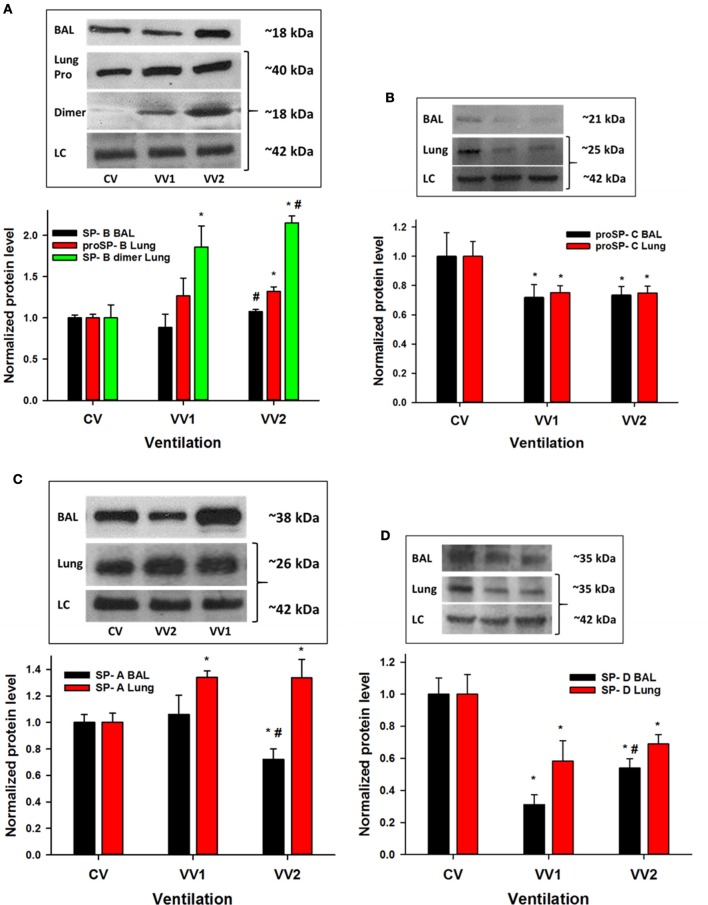
Figure 3.
Representative western blots and normalized surfactant protein (SP) levels from lavage fluid and lung tissue as a function of ventilation mode as described in Figure 1. (A) Top: representative western blots for SP-B (~18 kDa) in the bronchoalveolar lavage (BAL), proSP-B (~40 kDa) from lung tissue, the dimer form of SP-B (~18 kDa) from lung tissue and the loading control (LC) β-actin (~42 kDa). Bottom: statistics show that SP-B in BAL increases with VV2 relative to VV1 (p < 0.005). The proSP-B is higher during VV2 than CV (p < 0.005) whereas the levels of the dimer are different for all pairwise comparisons (p < 0.001). (B) Top: representative western blots for proSP-C (~21 kDa) in BAL and lung tissue (~25 kDa) together with the β-actin LC (~42 kDa). Bottom: Compared to CV, proSP-C decreases with VV1 and VV2 both in the lavage (p < 0.001) and the lung (p = 0.006). (C) Top: representative western blots for SP-A (~38 kDa) in BAL and lung tissue (~26 kDa) together with the β-actin LC (~42 kDa). Bottom: Compared to CV, SP-A in the lavage decreases with VV2 (p < 0.001), and in the lung, it increases with VV1 and VV2 (p < 0.001). (D) Top: representative western blots for SP-D (~35 kDa) in BAL and lung tissue (~35 kDa) together with the β-actin LC (~42 kDa). Bottom: Compared to CV, SP-D decreases with VV1 and VV2 both in the lavage and the lung (p < 0.001) and there is also a significant difference between VV1 and VV2. * and # denote statistically significant difference from CV and VV1, respectively.

