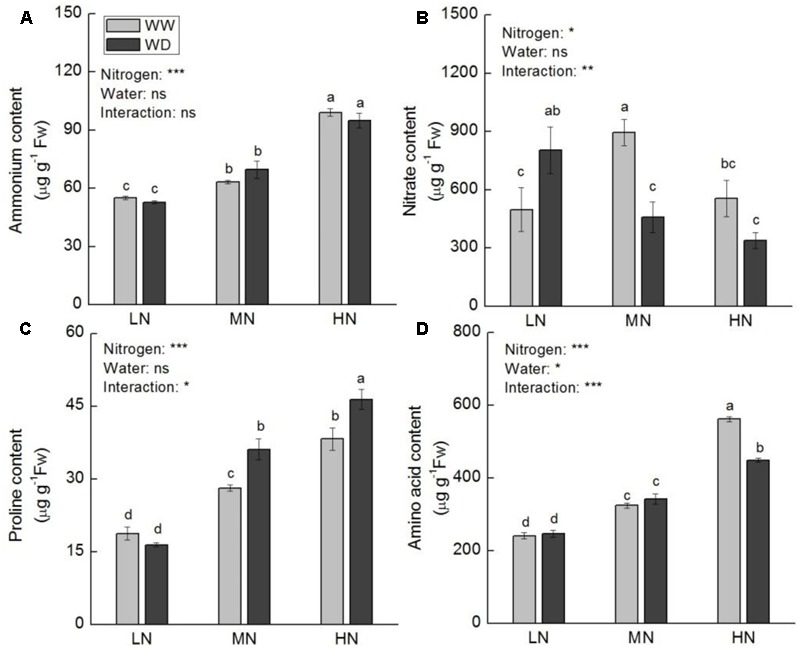
FIGURE 6.

Comparison in the contents of ammonium (A), nitrate (B), proline (C), and free amino acid (D) in rice plants grown udner different nitrogen and water conditions. Data refers to mean ± SE (n = 4). P-values of the two-way ANOVAs of nitrogen, water, and their interaction are indicated: ns, not significant; ∗P < 0.05; ∗∗P < 0.01; ∗∗∗P < 0.001. Bars with the same letter are not significantly different by LSD test. WD, water deficit; WW, well-watered.
