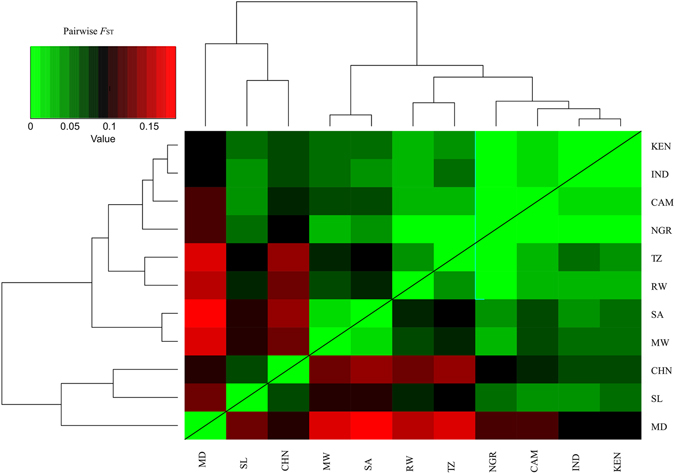
Figure 3.

Heat map depicting pairwise F ST estimates between countries. The map was generated by using the ‘heatmap.2’ function from the gplots package in R using pairwise F ST matrix calculated in StAMPP. Populations (countries) are across the X- and Y-axis, with each square indicating the F ST estimate between the two respective individuals. The magnitude of the genetic differentiation is indicated by the colour range. MD, Madagascar; SL, Sri Lanka; CHN, China; MW, Malawi; SA, South Africa; RW, Rwanda; TZ, Tanzania; NGR, Nigeria; CAM, Cameroon; IND, India; KEN, Kenya.
