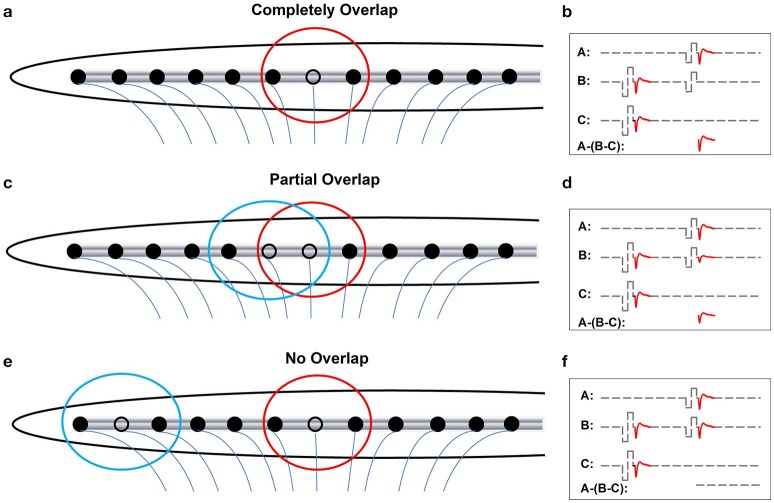
Figure 3.
Schematic illustration of effects of increasing distance between the masker- and the probe-electrode on recorded eCAP response. Blue and red circles indicate electrode field evoked by the masker and the probe pulse, respectively. (a, b) Illustrate the condition where the masker pulse and the probe pulse are delivered to the same electrode. (c, d) Illustrate cases where the masker- and the probe-electrode are close to each other, which yields partially overlapped electrode fields. (e, f) Illustrate conditions where there is a large separation in distance between the masker- and the probe-electrode, which results in two separated electrical fields.

