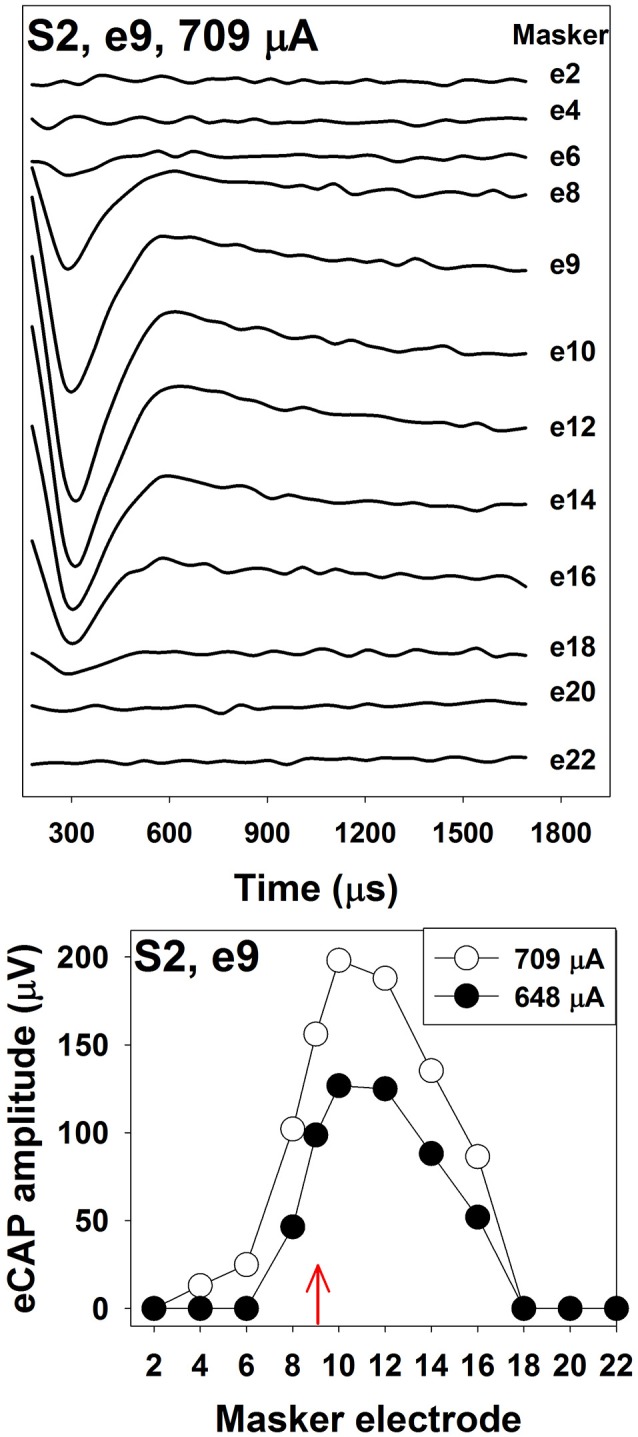
Figure 4.

The top panel shows eCAP response series used to generate a channel-interaction function in S2. Each waveform is the derived eCAP measured for a probe pulse presented to electrode 9 at 709 μA. Masker electrode number is labeled for each trace. The bottom panel shows channel-interaction functions measured at 709 μA (open symbols) and 648 μA (filled symbols) in for the probe electrode 9 (red arrow) in S2.
