
Figure 2.
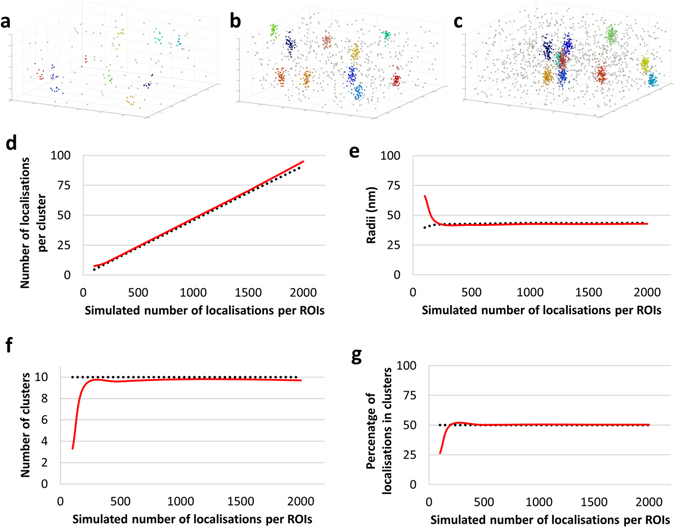
Examining the effect of increasing total number of localisations in the ROI on the Bayesian cluster analysis of simulated data sets (n = 30 simulations) from 100 localisations per ROIs to 2000 localisations per ROIs, under the Standard Conditions. Representative cluster maps with (a) 200, (b) 1000 and (c) 2000 localisations within the 3000 × 3000 × 600 nm ROI. (d) Mean number of detected localisations per cluster as a function of the number of localisations per cluster, compared to the simulated (true) value, (e) mean cluster radii as a function of the number of localisations per cluster, compared to the simulated (true) value, (f) mean number of detected clusters per ROI as a function of the number of localisations per cluster, compared to the simulated value and (g) mean percentage of localisations detected in clusters as a function of the number of localisations per cluster, compared to the simulated value. Red = results of the analysis, black = simulated values.