
Figure 3.
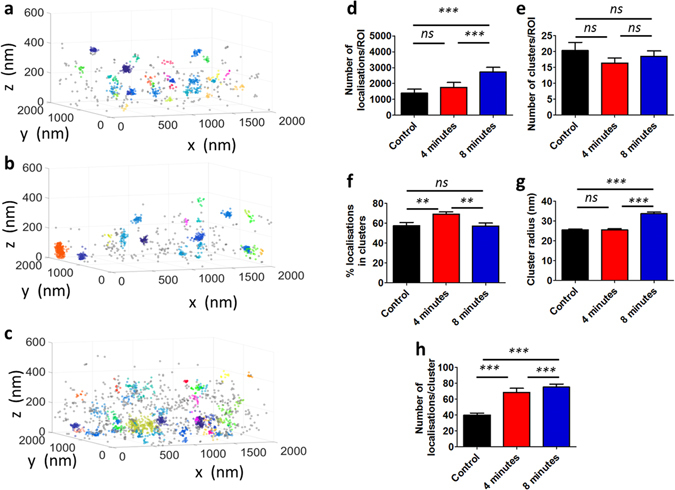
3D Bayesian cluster analysis of iPALM data of the distribution of LAT at the T cell immunological synapse. Representative cluster maps of LAT-mEos3.2 (a) in non-activated T cells, (b) in T cell synapses fixed after 4 mins, (c) in T cell synapses fixed after 8 mins. For each condition, (d) total number of localisations per ROI, (e) number of detected clusters per ROI, (f) percentage of localisations in clusters for each ROI, (g) cluster radii and (h) number of localisations per cluster. Bars represent mean values and S.E.M. ns = not significant, *p ≤ 0.01, **p ≤ 0.001, ***p ≤ 0.0001, Mann-Whitney U Test.