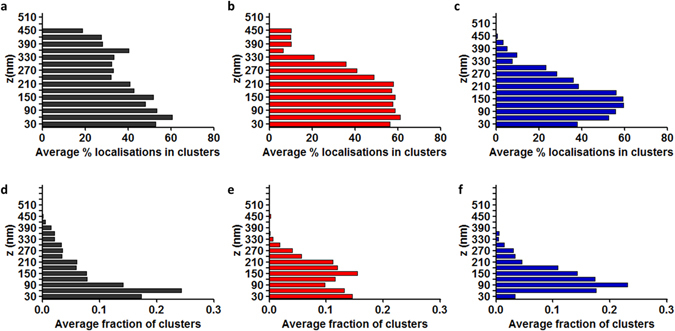
Figure 4.

Histograms of the z distribution of LAT at the T cell immunological synapse. (a) Average percentage of localisations in clusters at each z plane for the control condition. (b) Average percentage of localisations in clusters at each z plane for 4 minutes post-activation. (c) Average percentage of localisations in clusters at each z plane for 8 minutes post-activation. (d) Average fraction of number of clusters at each z position for the control condition. (e) Average fraction of number of clusters at each z position for 4 minutes post-activation. (f) Average fraction of number of clusters at each z position for 8 minutes post-activation. Histogram bins are 30 nm.
