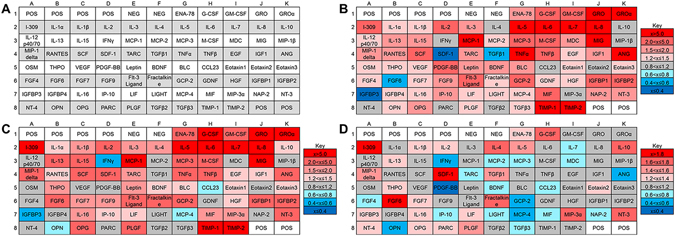
Figure 2.

HUVECs and DRGs secreted a variety of proteins. (A) Map of cytokine array used to determine protein secretion from (B) HUVEC monocultures and (C) DRG-HUVEC co-cultures normalized to EGM-2 medium. To determine how the DRG population affected the secretion and consumption of proteins, (D) results from arrays assayed with DRG-HUVEC co-cultures were normalized to HUVEC monocultures. In all cases, red indicates overexpression of indicated proteins and blue indicates underexpression of indicated proteins, with gradations of each color indicating relative amount of over/under expression. POS and NEG wells are internal controls within the cytokine array assay. Data are compiled from two independent replicates.
