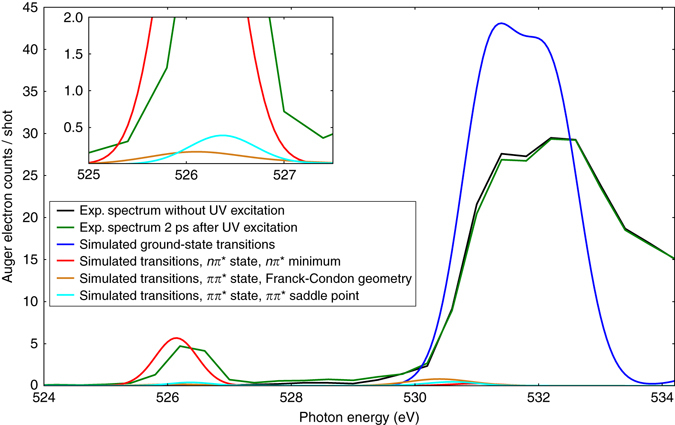
Fig. 4.

Comparison of experimental and simulated spectra. Simulated near-edge absorption fine structure spectra of the ground state, the ππ* state in the Franck–Condon region and at the saddle point, and the nπ* state at its minimum. For comparison, the experimental ground-state spectrum and the experimental spectrum 2 ps after ultraviolet (UV) excitation are shown. Relative intensities of simulated and experimental ground-state spectra are adjusted to an equal peak area of the π* resonances. Simulated excited-state spectra are scaled with respect to the ground-state spectrum assuming 13% excitation. The inset shows a detailed view of the intensity relations at the position of the excited-state feature. Contributions from K-edge ionization were not included in the simulations
