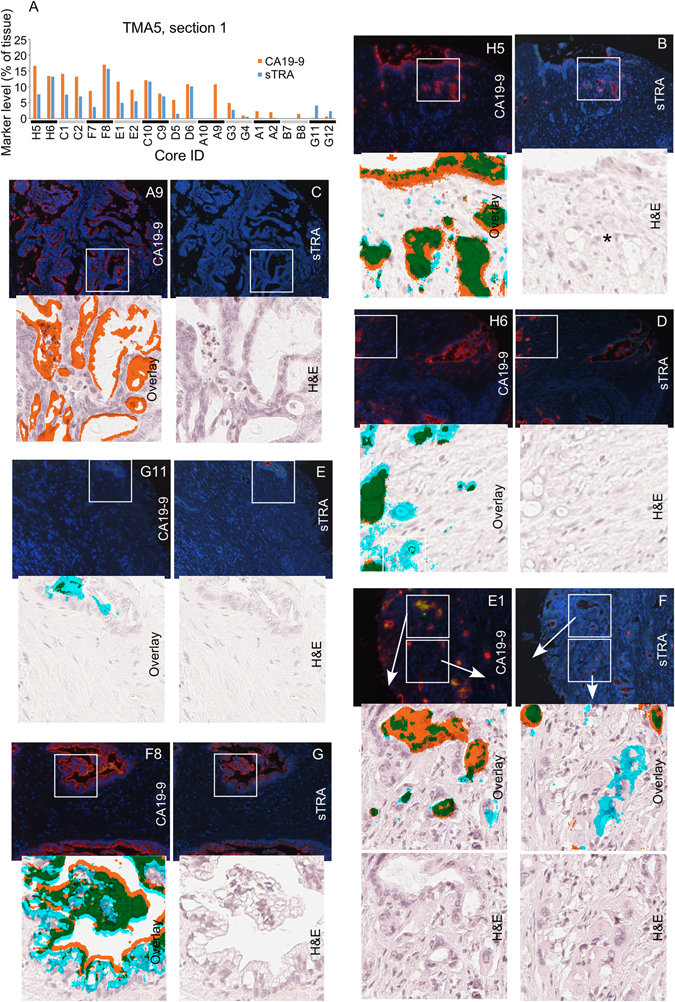
Figure 3.

Cellular morphologies associated with each glycan. (A) The cores had various levels of each antigen. The TMA contained two cores from each tumor, presented in pairs in the column graph. (B–G) The top two images in each group are the raw fluorescence from the second (left) and third (right) rounds of immunofluorescence. The red signal in the left image is CA19-9, and the red signal in the right image is sTRA. The lower images in each group are zoomed pictures corresponding to the white box. The lower left image is the H&E image overlaid with the detected signals. The signal from CA19-9 is orange, the signal from sTRA is cyan, and the overlapping signal is green. The lower right image is from the H&E stain. The asterisk in panel B marks vacuolated, invasive cells.
