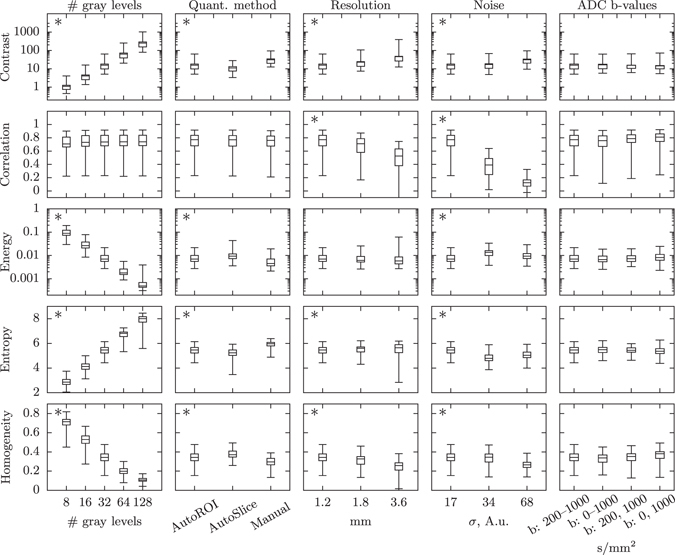
Figure 1.

Changes in texture feature distributions with different imaging and pre-processing settings. The box plots show the distribution of contrast, correlation, energy, entropy and homogeneity for the 72 ROIs in the glioma data set. The box shows the first and third quartiles, with the median value indicated by the center line. The whiskers show the extreme values. An asterisk in the upper left corner indicates that at least one pair of settings is significantly different.
