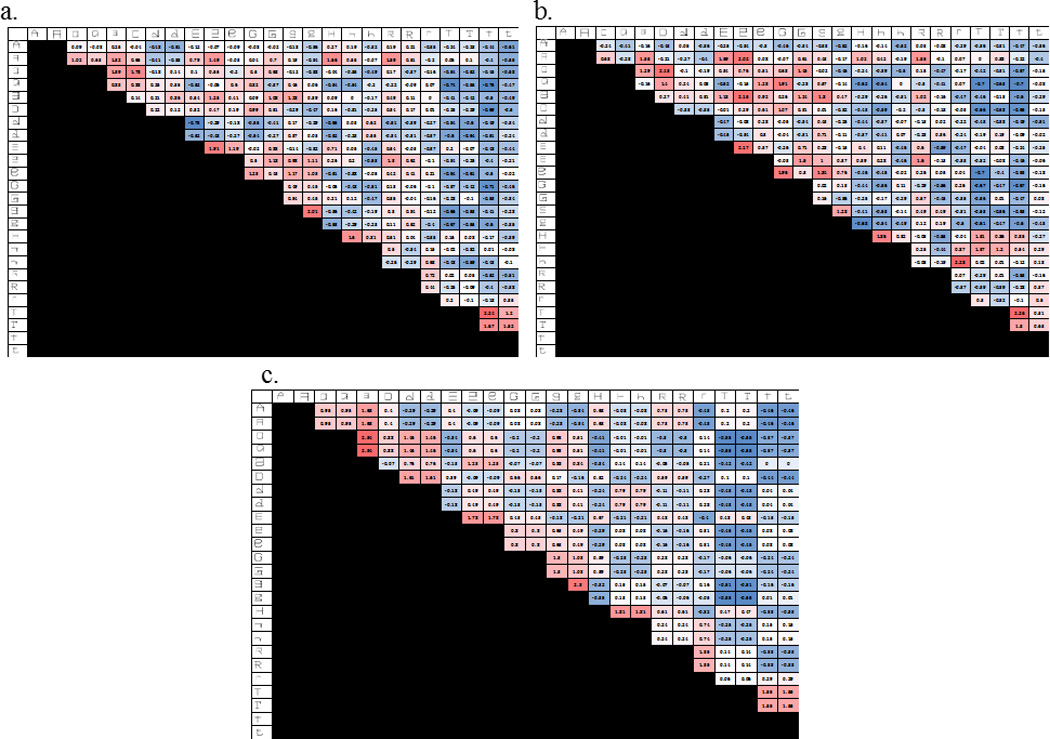
Figure 5.

The group representational similarity matrices (RSMs) obtained from Experiment 1. Red cells indicate larger average similarity judgments and blue cells indicate smaller average similarity judgments. a) The group RSM for the similarity judgments to letter-pairs presented in the atypical Upright Gridfont. The Gridfont letters are depicted on the margin. The group RSM was formed by normalizing each participant’s responses to have a mean of 0 and a standard deviation of 1 and then averaging the normalized responses to each letter-pair across participants. b) The group RSM for the similarity judgments to letter-pairs presented in the atypical Rotated Gridfont. c) The group RSM for the similarity judgments to letter-pairs presented in the Typical font.
