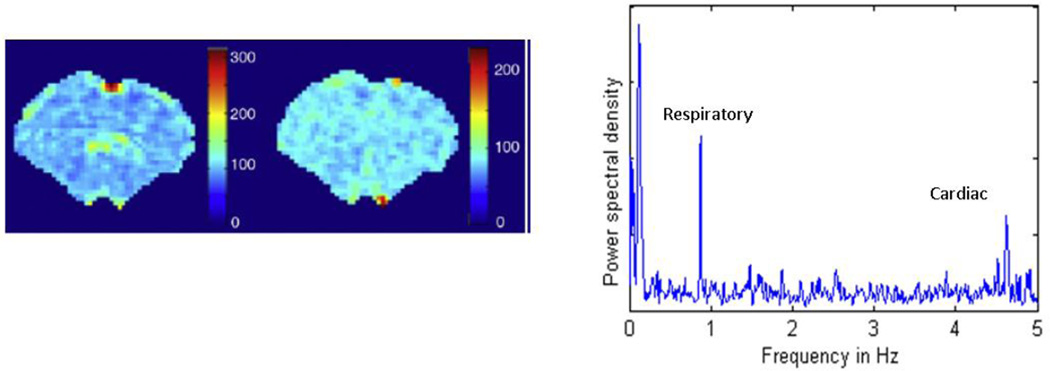
Figure 3. Distribution of cardiac and respiratory noise in the anesthetized rat.
(Left) The relative power for the respiration peak, plotted for each voxel in the brain. Most of the power is localized to medial surface areas near the sagittal sinus. (Center) The relative power for the cardiac peak, plotted for each voxel in the brain. Strong contributions are localized to a few spots near the surface and base of the brain. All data were obtained from a rs-fMRI scan in a rat anesthetized with alpha-chloralose and a TR of 100 ms (adapted from (Williams et al., 2010)). (Right) The power spectrum for one pixel demonstrating low frequency BOLD oscillations, respiration, and cardiac pulsation. Note that the animals in this study were anesthetized with alpha-chloralose and mechanically ventilated, which accounts for the sharpness of the respiratory peak.

