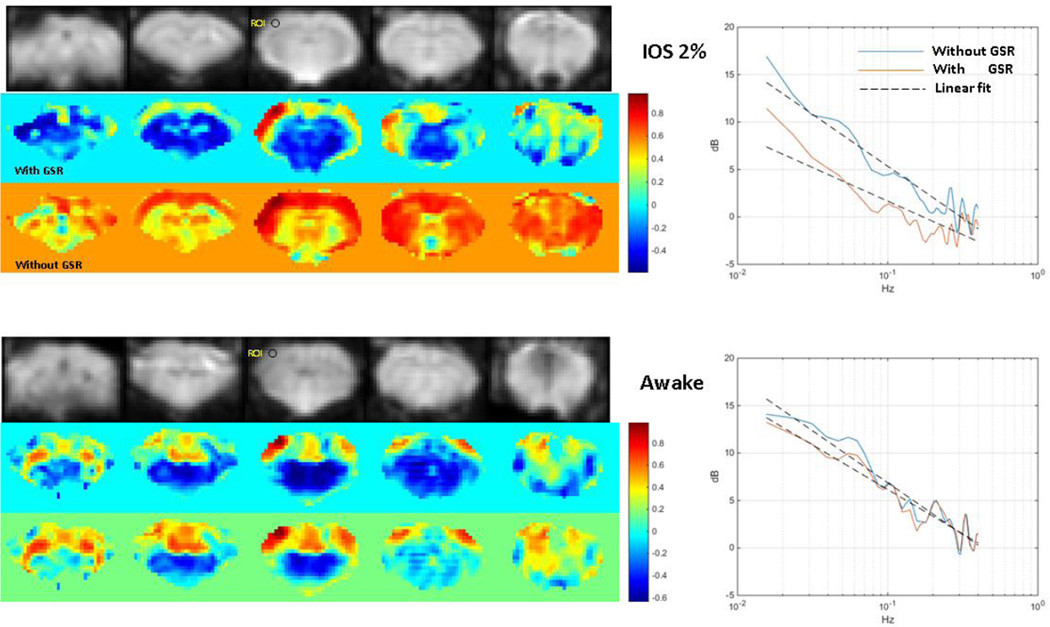
Figure 6. BOLD power spectra from awake and anesthetized rats.
Resting state MRI data (9.4T; TR 1s; TE 14ms; 20 slices; 0.5 × 0.5 × 1 mm voxels; 1000 repetitions) was acquired from two rats that had been acclimated to the scanner. Each was originally anesthetized with isoflurane, then allowed to wake up inside the MRI scanner as data was acquired. Power spectra were calculated for the whole brain BOLD signal by Welch's method with 8 segments and 50% overlap. In both animals, the power during the initial scan acquired under anesthesia is low but increases as the rat is allowed to wake up. Maximal power is observed in the second scan acquired with 0% isoflurane after the anesthetic has completely worn off. As the animals are re-anesthetized, the power decreases to approximately the original level.

