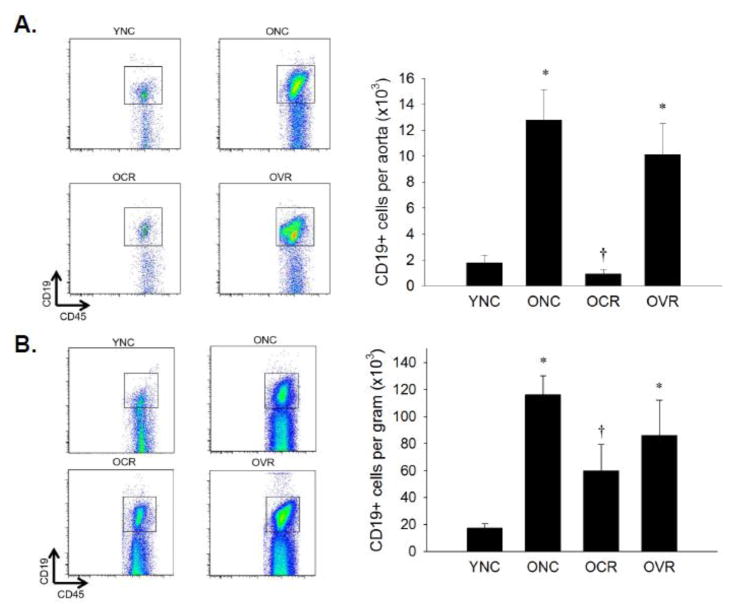
Figure 3. B cell infiltration of aorta and mesenteric vascular arcade.
Aortas (A) and mesenteric vascular arcade (B) from young normal chow (YNC), old- (O) normal chow (NC), voluntary running (VR) and calorie restricted (CR) mice were digested to a single cell suspension and stained with antibodies against CD45 and CD19 to assess B cell infiltration. Representative flow cytometry plots are shown on the left of each panel, summary data is shown on the right. n = 5–11/group. Differences were assessed with one-way ANOVA with LSD post hoc tests. * different from YNC, † different from ONC, p≤0.05. Data are means ± SEM.

