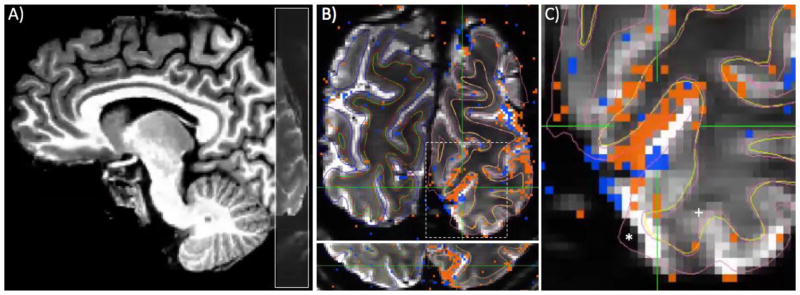
Figure 1.
Functional imaging slice placement, GLM results, and residual distortion. A) Coronal slices (gray overlay) covered a portion of occipital cortex, with 0.8 mm (isotropic) resolution. B) Cortical surfaces (thin lines) and results of GLM (stimulus on minus stimulus off, collapsing across left and right visual hemifield; orange indicates positive fMRI responses; blue, negative) are visualized on functional data after distortion compensation and registration to reference T1-weighted anatomy. In most places, there is excellent agreement between WM/GM/CSF contrast in EPI images and cortical surfaces. C) The crosshairs are centered on a region judged to have good alignment, and included in further analyses. However, large errors are also1 shown, where the GM surface (pink line) from the reference anatomy extends beyond the limit of the tissue seen in EPI data (indicated by *) and where WM surfaces (yellow line) fail to align to evident contrast in EPI data (+). Regions such as this were excluded from further analysis.

