
Figure 4. Cardiovascular MRI suggests myocardial vascular leak in SCLS.
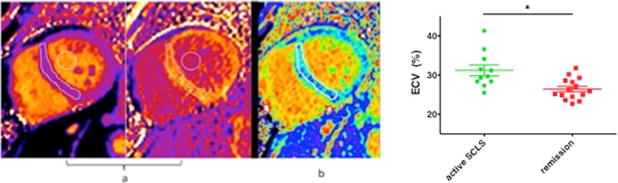
(A) Pre-and post-contrast myocardial T1 maps in a patient with SCLS. Regions of interest drawn within the septum and blood pool are used to calculate the extracellular volume fraction (ECV). (B) Mid-ventricular short axis ECV map in the same patient. The color scale for displaying ECV values was chosen so that green colors represent the mean ± 3 s.d. of normal myocardium from age-matched controls. (C) CMRI demonstrates increased myocardial ECV in patients with active VEH compared to asymptomatic group. **p=0.003, Mann-Whitney. Adapted from References56, 57.