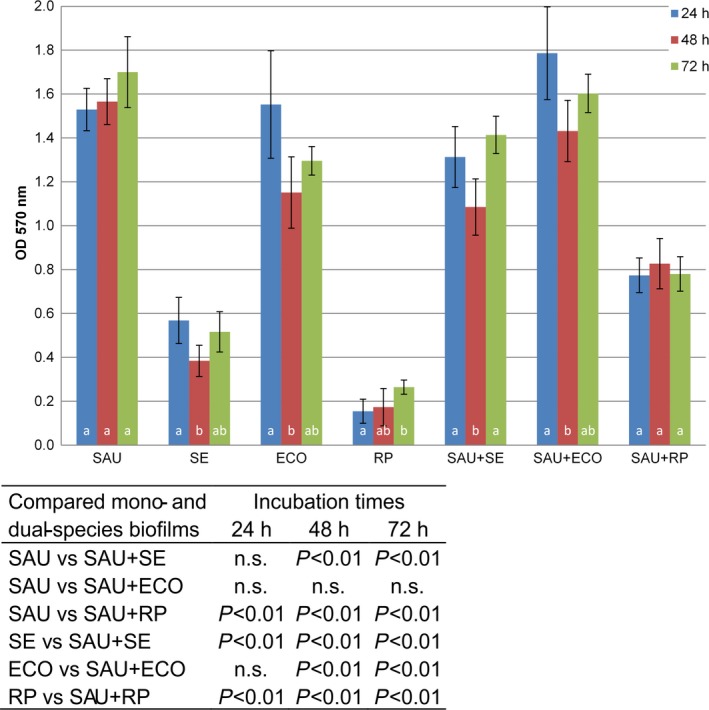
Figure 1.

Crystal violet quantification of mono‐ and dual‐species biofilms of Staphylococcus aureus and Gram‐negative bacteria.
The columns represent mean values of OD 570 nm; the vertical bars denote the 95% confidence intervals of these means. Letters above the x‐axis denote statistically significant differences (P < 0.05 at least) among incubation times (columns sharing the same letter are not significantly different from each other; columns that have no letter in common are significantly different from each other). The table embedded within the figure shows the significance of differences in OD 570 nm between mono‐ and dual‐species biofilms (ANOVA followed by post hoc Bonferroni multiple comparison tests).
