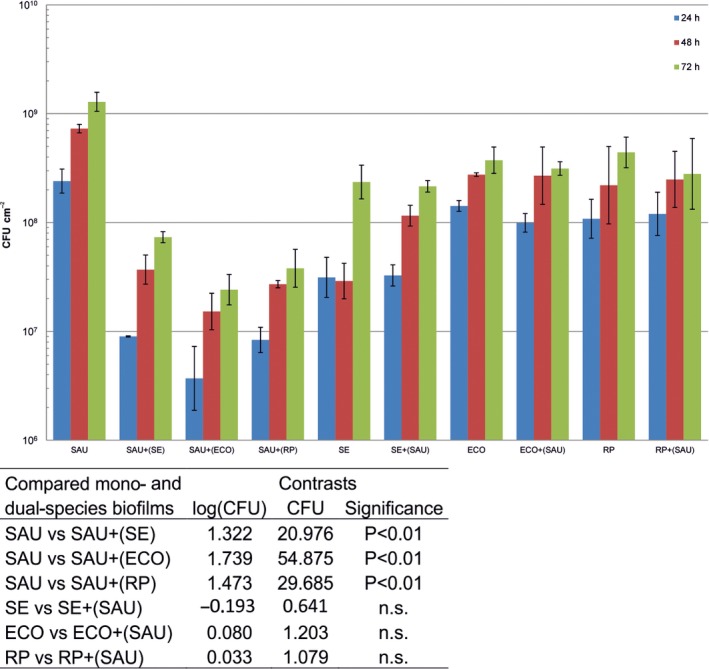
Figure 2.

Viable cell counts of mono‐ and dual‐species biofilms.
The columns represent values of geometric means of CFU cm−2; vertical bars correspond to geometric standard deviations. The y‐axis is scaled logarithmically. Table 1b shows the significance of differences between mono‐ and dual‐species biofilms (ANCOVA followed by a testing of contrasts). The slope of the covariate (incubation time) is 0.014, that is CFU cm−2 increased on average 2.16× (P < 0.01) in 24 h. SAU, S. aureus; SE, S. enterica; ECO, E. coli; RP, R. planticola; SAU+SE, co‐culture of S. aureus and S. enterica, etc.; SAU+(SE), number of viable S. aureus cells when co‐cultured with S. enterica; SE+(SAU). Number of viable S. enterica cells when co‐cultured with S. aureus, etc.; n.s. non‐significant.
