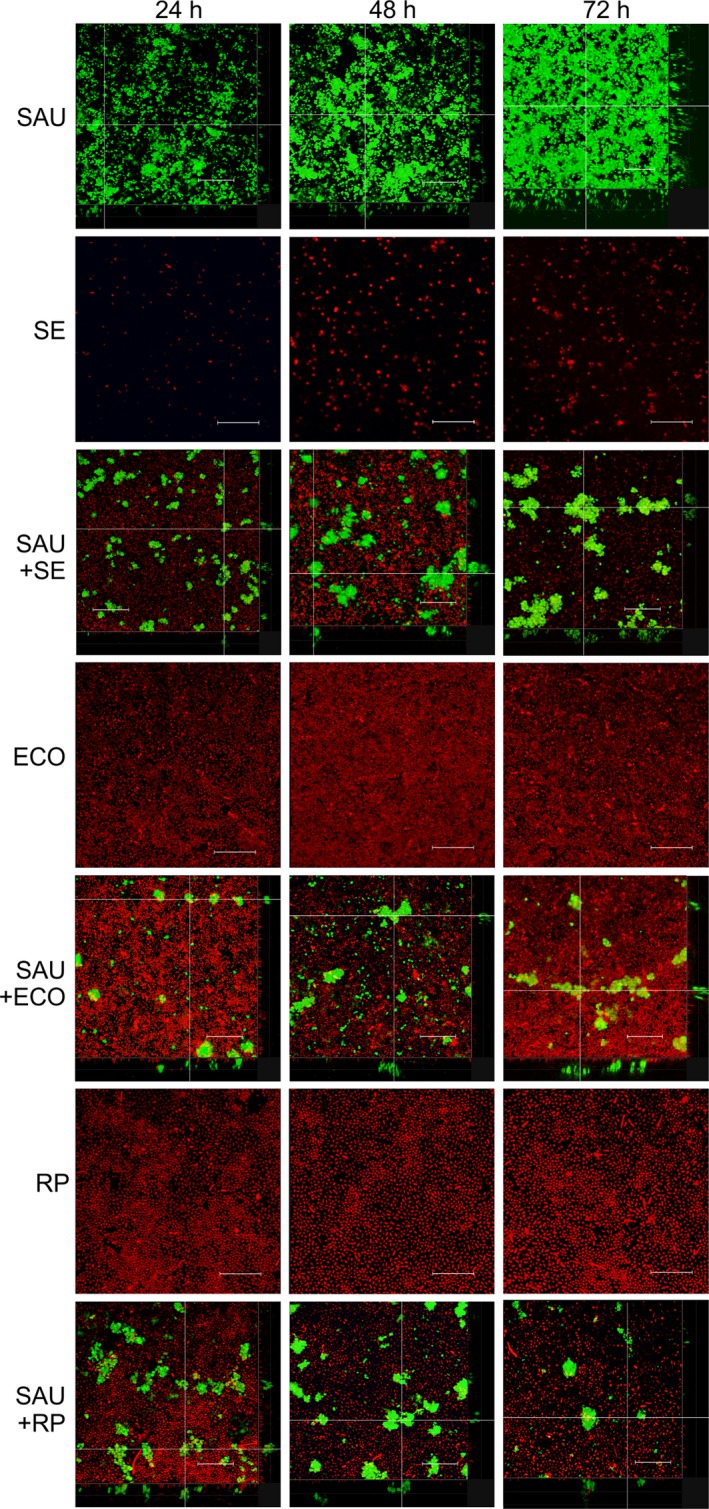
Figure 3.

Representative CLSM images of monocultures and dual‐species biofilms formed by Staphylococcus aureus and Gram‐negative bacteria.
SAU, S. aureus; SE, Salmonella enterica; ECO, E. coli; RP, R. planticola; SAU+SE, S. aureus and S. enterica dual‐species biofilms, etc. Scale bar represents 25 μm.
