Figure 1.

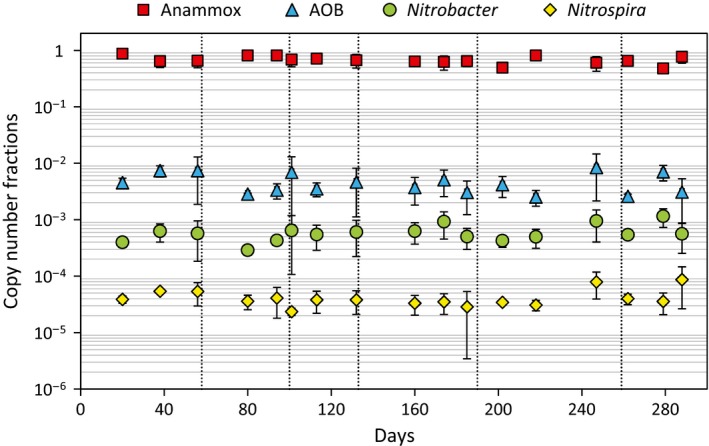
Relative abundances (copy number fractions) of nitrogen converting bacteria measured by qPCR. The periods in the study are separated by vertical dashed lines. Average values. Error bars show standard deviation.

Relative abundances (copy number fractions) of nitrogen converting bacteria measured by qPCR. The periods in the study are separated by vertical dashed lines. Average values. Error bars show standard deviation.