Figure 6.
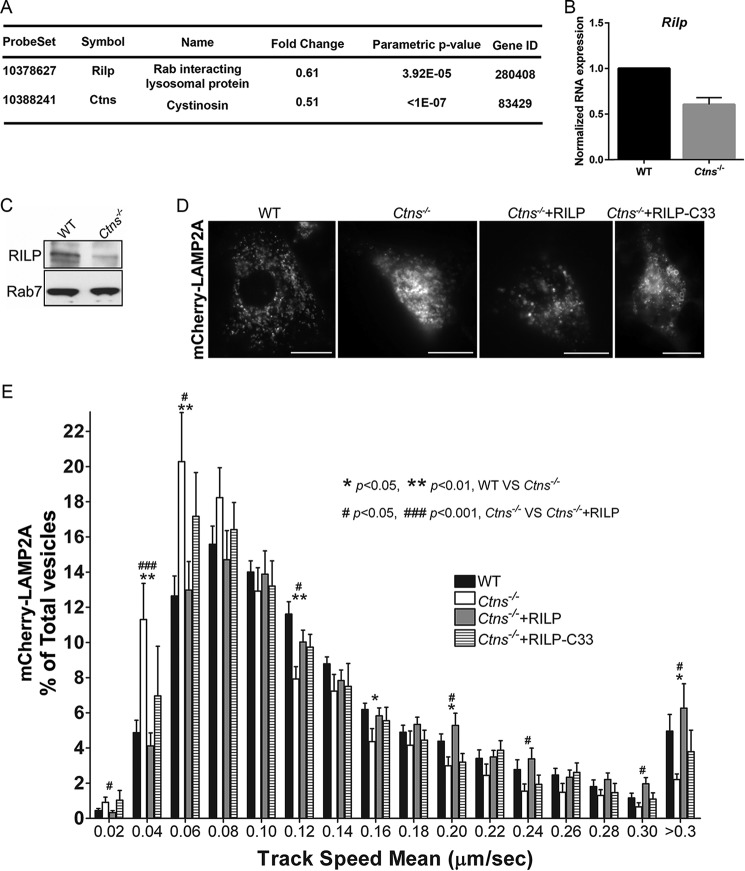
RILP is down-regulated in cystinosis and its expression rescues LAMP2A trafficking. A, differential gene expression between wild-type and Ctns−/− kidneys from six independent mice was analyzed using a mRNA array as described under “Materials and methods.” From the 28,853 genes used for random variance estimation 3,260 were found to be significantly different between classes at the nominal 0.001 level of the univariate test. One of these genes, Rilp, a Rab7-binding protein involved in lysosomal trafficking, was significantly down-regulated (fold change indicates gene expression in Ctns−/− kidneys versus wild-type controls). The values observed for the Ctns gene are included as control. B, qRT-PCR analysis confirmation of Rilp down-regulation in Ctns−/− mouse fibroblasts. Mean ± S.D. C, Western blot analysis confirmed that RILP, but not its binding partner Rab7, is down-regulated, at the protein level, in cystinotic MEFs. D and E, RILP expression rescues LAMP2A trafficking in cystinotic cells. Wild-type (WT) or Ctns−/− MEFs were transfected with mCherry-LAMP2A. Where indicated, the cells were co-transfected for the expression of RILP or RILP-C33 (a truncated form of the protein lacking the N-terminal half). LAMP2A vesicular trafficking was performed by pseudo-TIRFM as described in Fig. 3 legend and under “Materials and methods.” D, representative images of analyzed cells. Scale bars, 20 μm. E, histograms representing the speeds of mCherry-LAMP2A-containing organelles in wild-type cells and cystinotic cells expressing either wild-type RILP or RILP-C33 are shown. The speeds for the independent vesicles were binned in 0.02-μm/s increments and plotted as a percentage of total vesicles for a given cell. Results are represented as mean ± S.E. from 20 WT cells, 11 Ctns−/− cells, or 17 and 16 Ctns−/− cells expressing either wild-type RILP or RILP-C33, respectively. The statistically significant differences between the groups are indicated in the figure.

