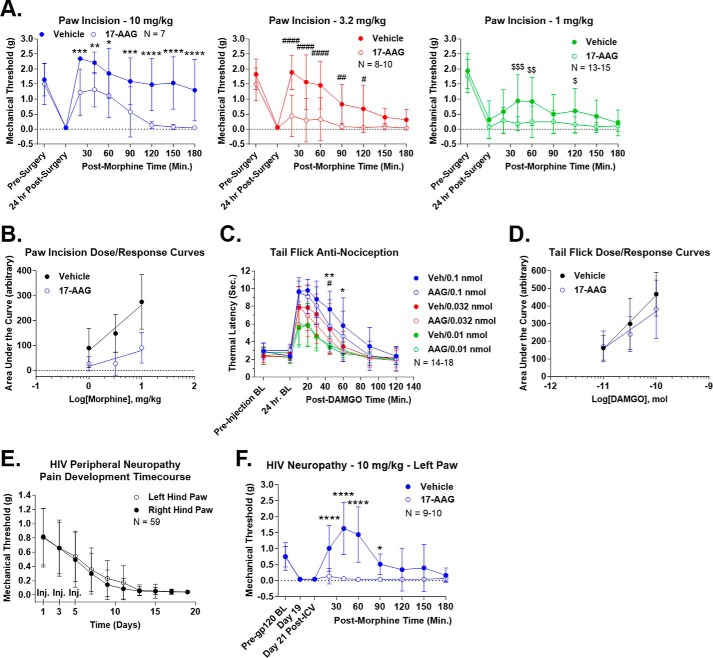
Figure 3.
Hsp90 inhibition decreases opioid-induced anti-nociception. All data are reported as the mean ± S.D. A, post-surgical pain was induced by paw-incision surgery, and mechanical thresholds were measured with Von Frey filaments as described under “Experimental procedures.” Vehicle or 17-AAG (0.5 nmol) was injected i.c.v. concurrent with surgery. After 24 h, morphine was injected (1, 3.2, or 10 mg/kg s.c.), and mechanical thresholds were measured over a time course. Each dose is reported in a separate graph. *, **, ***, and **** (same with # and $), p < 0.05, 0.01, 0.001, and 0.0001, respectively, versus same time point by two-way ANOVA with Fisher's least significant difference post-hoc test. AUC analysis results are summarized in Table 2. The reported sample size of individual mice includes two to three technical replicates for each dose on different days by the same experimenter. B, the AUC values from each individual mouse in A were used to construct dose-response curves, and linear regression analysis was performed to calculate the A50 values (see “Experimental procedures” and results in Table 2). Vehicle = 3.98 mg/kg and 17-AAG = 522.2 mg/kg, a 131.2-fold shift. The results suggest a strong decrease in potency for the system. C, 52 °C tail-flick baselines were determined as reported under “Experimental procedures” prior to and 24 h post-i.c.v. injection of vehicle or 0.5 nmol of 17-AAG. DAMGO (0.01, 0.032, or 0.1 nmol) was then injected i.c.v., and tail-flick latencies were determined over a time course. * and ** = p < 0.05 and 0.01, respectively, versus 0.1 nmol time point; #, p < 0.05 versus 0.032 nmol time point; both by two-way ANOVA with Fisher's least significant difference post-hoc test. AUC analysis results are summarized in Table 2. The reported sample size of individual mice includes three technical replicates for each dose from two different experimenters at different institutions; each replicate showed very similar results. D, dose-response curves were created and analyzed from C using the same method as described in B. The results are summarized in Table 2. Vehicle = 0.095 nmol and 17-AAG = 0.251 nmol, a 2.64-fold shift. The results suggest a modest decrease in efficacy for the system. E, HIV peripheral neuropathy was established using the method outlined under “Experimental procedures.” This figure demonstrates progressive, severe, mechanical allodynia, measured as described in A, over a 21-day treatment period. Both hind paws were measured, and the injection days were noted (Inj). The reported sample size of individual mice includes every HIV neuropathy mouse used in this study combined with six technical replicates by the same experimenter on different days. F, HIV neuropathy was established as described in E, with pre-gp120, day 19, and day 21 post-i.c.v. injection baselines noted. On day 20, vehicle or 17-AAG was injected i.c.v. as above followed by 10 mg/kg morphine s.c. on day 21. 17-AAG had no effect on pain baselines but abolished (AUC reduction of 97.6% (Table 2)) morphine anti-nociception. * and ****, p < 0.05 and 0.0001 versus same time point by two-way ANOVA with Fisher's least significant difference post-hoc test. The reported sample size of individual mice includes two technical replicates performed on different days by the same experimenter. Both hind paws showed extremely similar results, and thus only the data from the left paw is shown (data not shown).

