Figure 1.
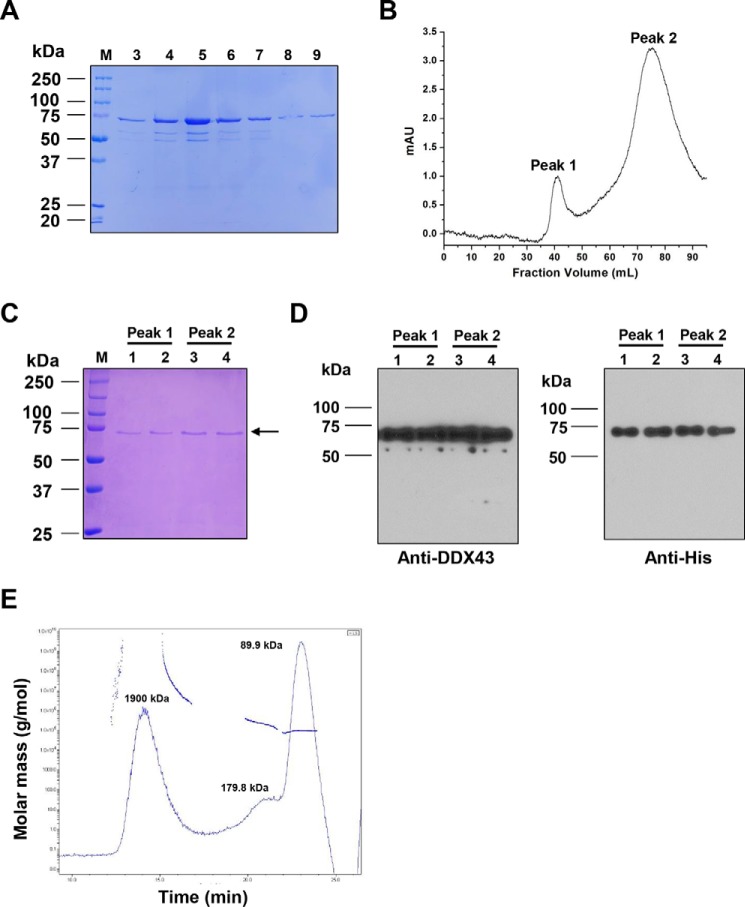
Purification and identification of DDX43 protein. A, SDS-PAGE analysis of the eluted DDX43 fractions from a Ni-NTA column. M, marker. Fractions 3–9 are shown. B, chromatographic profile of recombinant DDX43 proteins eluting from a Sephacryl S-300 HR column. Two peaks are indicated. mAU, milliabsorbance units. C, SDS-PAGE analysis of the peaks shown in B. D, Western blot analyses of the proteins shown in C with antibody against DDX43 (left) or His (right). E, SEC-MALS analysis of DDX43 protein shows the calculated molecular mass of the peak and the variation in the molecular weight across the peak for DDX43. The molecular mass for each peak was indicated.

